Майнинг
Диджитал-майнеры
Получайте ежедневные вознаграждения BTC без усилий
Калькулятор наград
Оцените свое возможное вознаграждение в BTC
Токен GOMINING
Узнайте, как GOMINING увеличивает вознаграждения за майнинг
Miner Wars
Соревнуйтесь и получайте BTC и GOMINING
Кошелек
Кошелек
Безопасно покупайте, отправляйте и получайте криптовалюту
Криптовалютные карты
Расплачивайтесь криптовалютой онлайн и в магазинах
Финансы
Simple earn
Зарабатывайте BTC на своих криптовалютах без блокировок
Instant Funds
Получите мгновенную ликвидность, используя свои активы как залог.
Launchpad
Доступ к криптопроектам ранних стадий
Путешествие
Путешествие
Бронируйте отели и авиабилеты по всему миру
eSIM
Скоро
Узнать
Академия
Изучайте криптовалюты шаг за шагом бесплатно
Блог и новости
Будьте в курсе последних событий и тенденций
Помощь клиентам
Найдите ответы или свяжитесь с нашей службой поддержки
Криптовалютный глоссарий
Ключевые крипто термины объясняются просто
Программы бенефитов
GoClub
Эксклюзивный клуб для обладателей аватаров GoMiner
GoMiners
Получите аватар GoMiner и откройте уникальные привилегии
Реферальная программа
Приглашайте друзей и получайте дополнительные вознаграждения
VIP-программа
Повысьте свой VIP-статус и получите доступ к более высоким привилегиям
Компания
Основные сведения
О компании
Стандарты GoMining и как все началось
Карьера
Работайте в глобальной крипто команде
Контакты
По вопросам поддержки или партнерства
Токеномика
Структура, функциональность и токеномика GOMINING
Отзывы о GoMining
Что говорят о GoMining миллионы пользователей
Для партнеров
Совет консультантов
Эксперты, определяющие долгосрочную стратегию GoMining
Отчеты и результаты
Отчеты о прозрачности и обновления о производительности
Поставщики услуг
Надежные партнеры по инфраструктуре
Institutional
Решения для майнинга биткойнов институционального уровня
GoBTC Pay
AI
Регистрация
Вход
Регистрация
RU
Назад
Новости
Monthly Market Update – June 2025: Structural Signals Amid Price Volatility
Aimara García Cabezas
Опубликовано:
1 июл. 2025 г.
·
Отредактировано:
26 авг. 2025 г.
·
Время чтения:
9 мин
GoMining News
Все новости
March 20, 2026
Реферальный конкурс Simple earn: выиграйте долю от 100 000 GOMINING
February 10, 2026
Карты для друзей: приглашайте друзей, открывайте награды и выигрывайте призы
February 10, 2026
Расширение GoMining карт — теперь доступны в 130+ странах
February 6, 2026
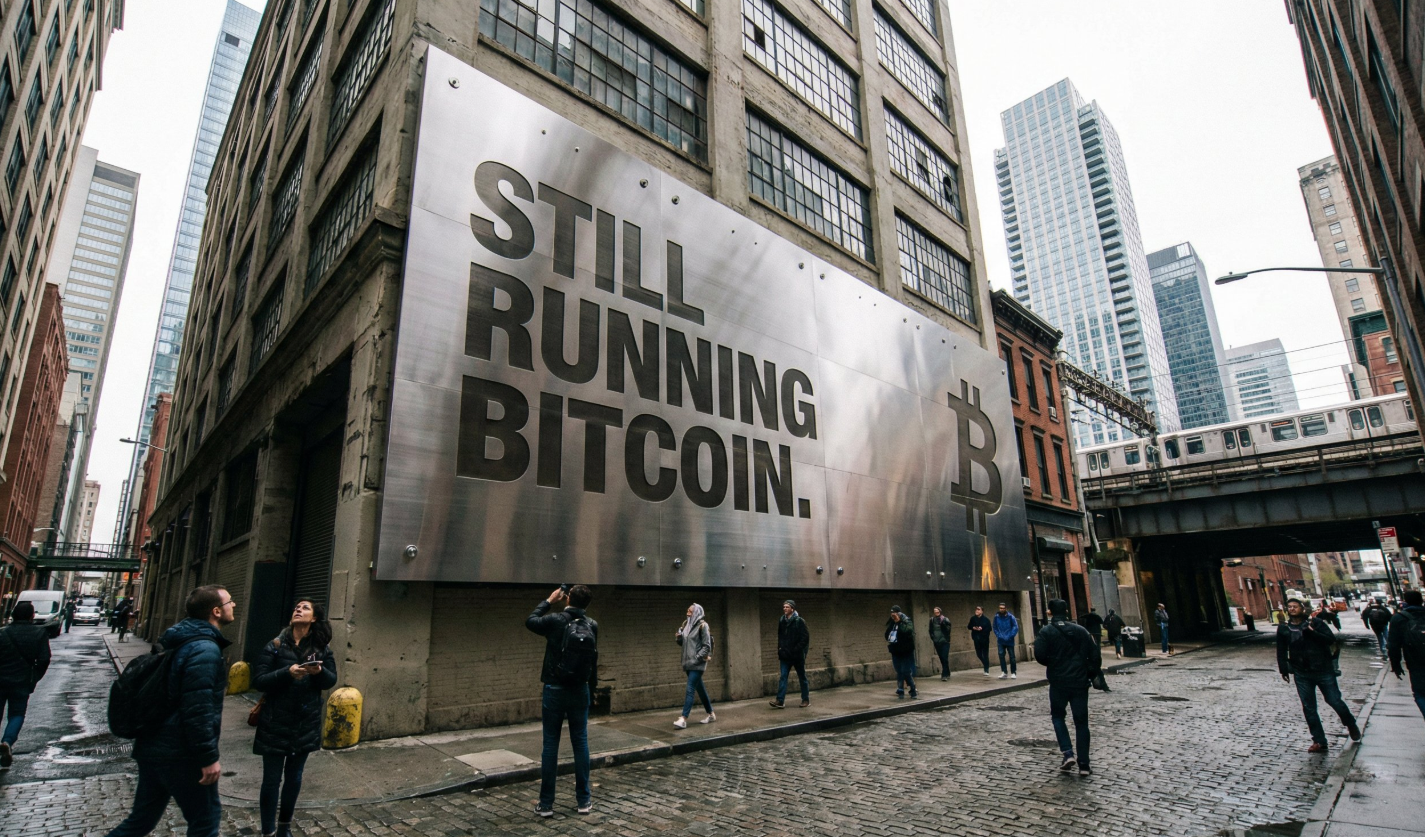
Оставайтесь сильными. Верьте в Биткоин
February 6, 2026
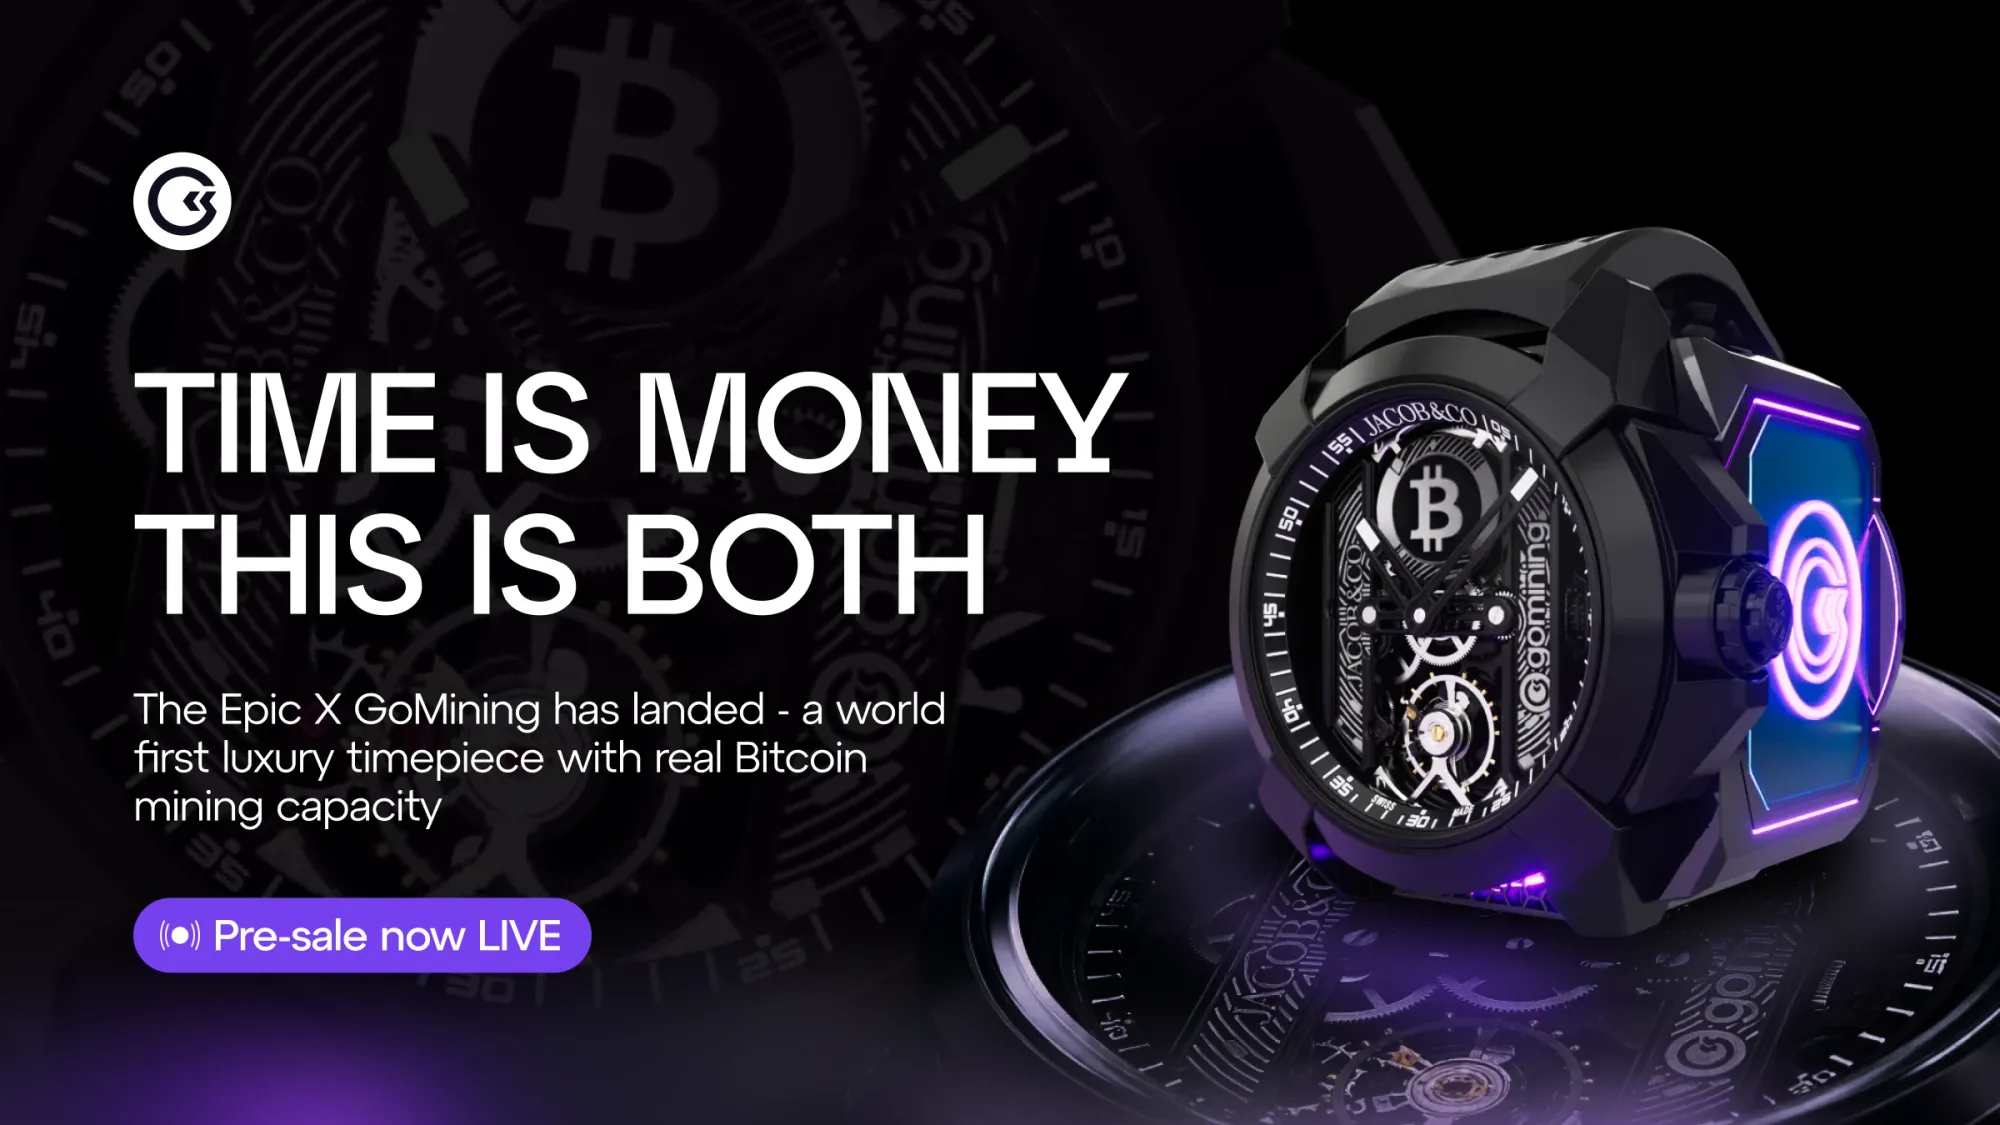
Epic X GoMining: заказы уже доступны на GoMining Marketplace
February 5, 2026
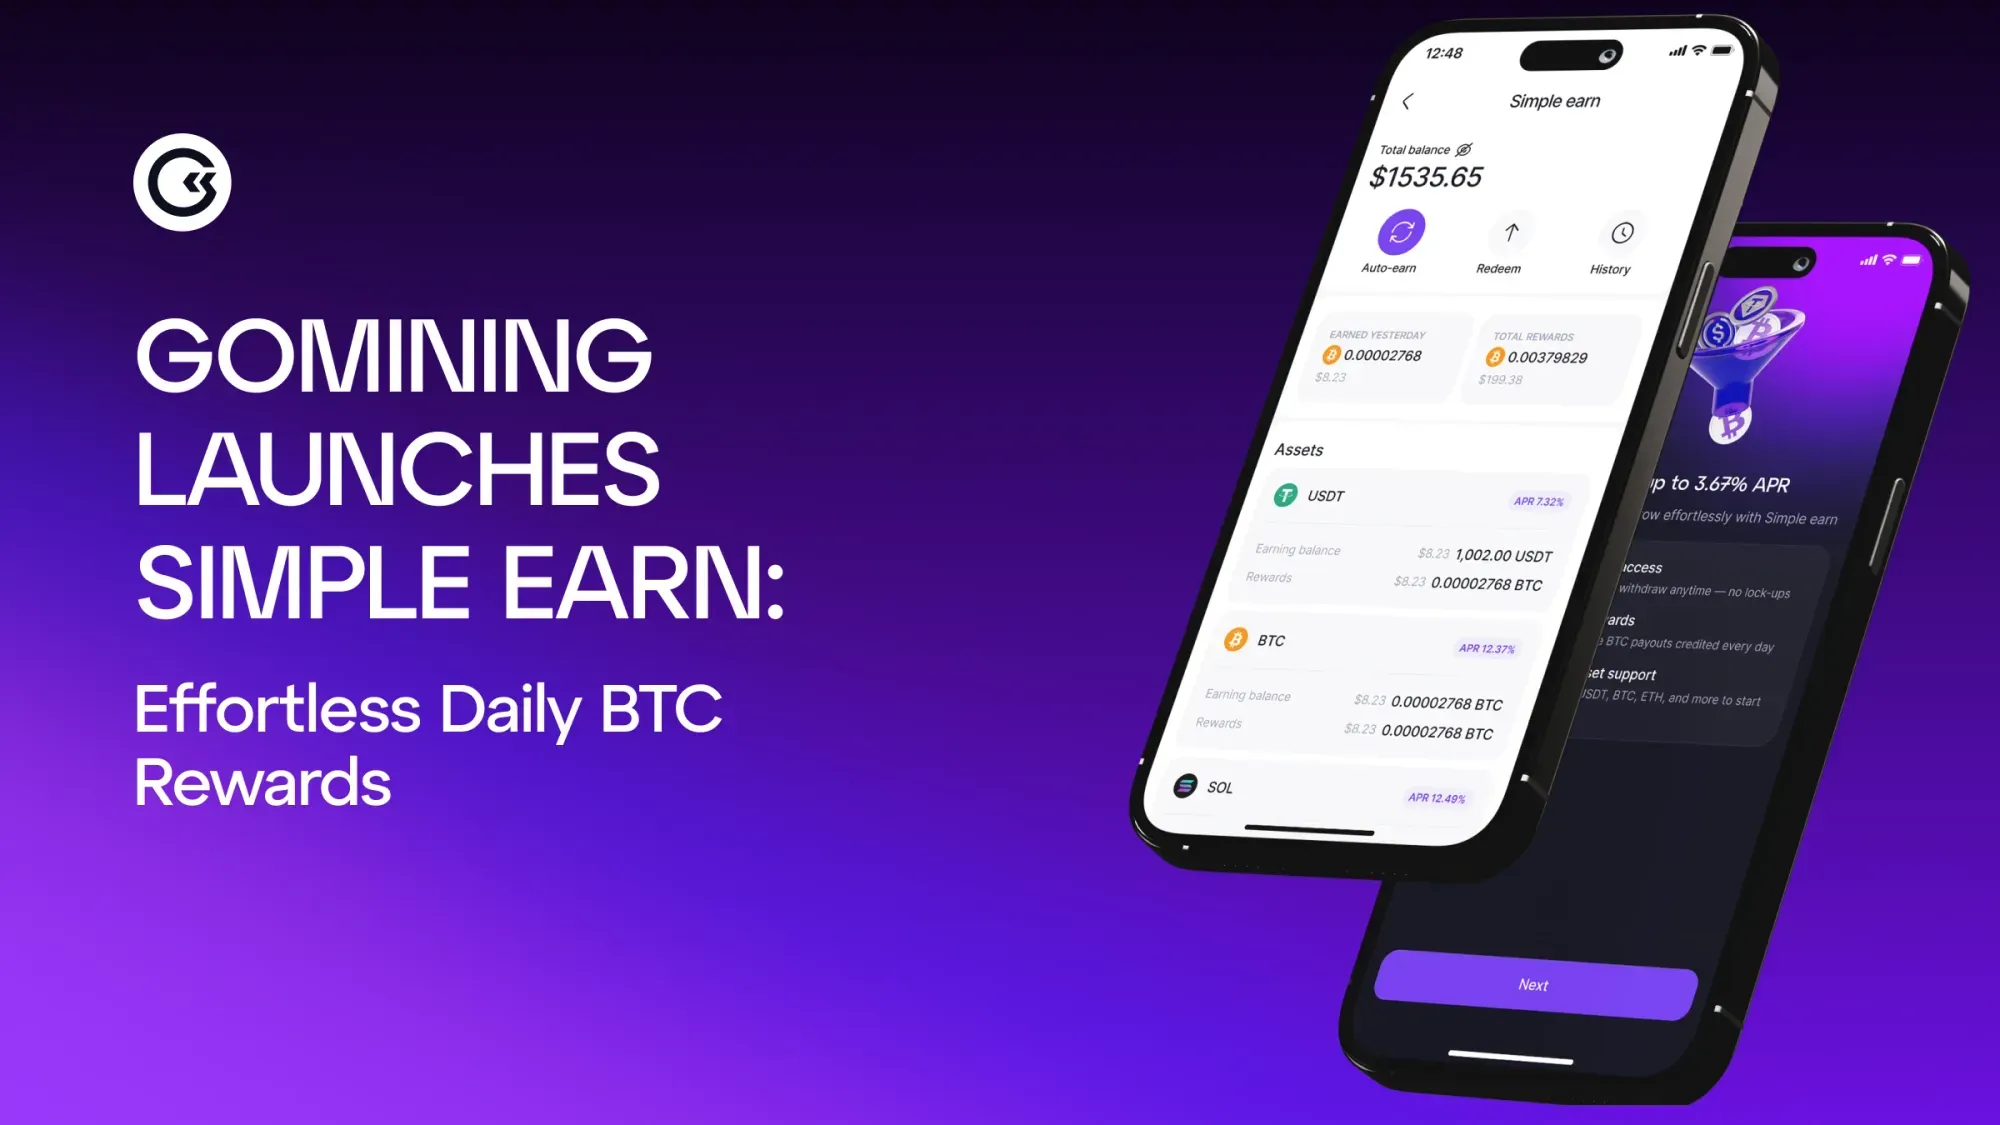
Simple Earn уже здесь — Получайте доход в биткоине с неиспользуемых криптоактивов
February 3, 2026
Розыгрыш Dragon Box: откройте новый формат GoBox
Вам может быть интересно:
January 25, 2026
ТОП-5 лучших и худших сценариев цены Base в 2026 году
January 8, 2026
ТОП-5 лучших и худших прогнозов цены Ripple (XRP) на 2026 год
December 26, 2025
Криптокиты: кто они и как их вычислить
February 10, 2026
Карты для друзей: приглашайте друзей, открывайте награды и выигрывайте призы