Bitcoin mining
Digital miners
Earn daily BTC rewards effortlessly
Reward calculator
Estimate your potential BTC rewards
GOMINING token
Learn how GOMINING boosts your mining rewards
Miner Wars
Compete and earn BTC and GOMINING
Wallet
Wallet
Buy, send, and receive crypto securely
Crypto cards
Pay with crypto online and in stores
Web 3.0 Wallet
Coming soon
Finance
Simple earn
Earn BTC on your crypto with no lock-ups
Loans
Coming soon
Launchpad
Access early-stage crypto projects
Travel
Travel
Book hotels & flights worldwide
eSIM
Coming soon
Learn
Academy
Learn crypto step by step for free
Blog & News
Stay updated with insights and trends
Customer help
Find quick answers or contact our support team
Crypto glossary
Key crypto terms explained simply
Benefit programs
GoClub
Exclusive club for GoMiner avatar holders
Referral program
Invite friends and earn extra rewards
VIP program
Increase your VIP status and access higher benefits
Company
General
About
What GoMining stands for and how it all started
Careers
Work with a global crypto team
Contacts
For support or partnership inquiries
Tokenomics
GOMINING's structure, utility, and token flow
GoMining reviews
What millions of users say about GoMining
For partners
Advisory board
Experts guiding GoMining's long-term vision
Reports and results
Transparency reports and performance updates
Service providers
Trusted infrastructure partners
Institutional
Institutional-grade Bitcoin mining solutions
Sign up
Log in
Log in
Sign up
EN
Back
News
Technical Analysis for Cryptocurrencies: How to Read Charts?
Aimara García Cabezas
Published:
Aug 18, 2025
·
Edited:
Aug 18, 2025
·
Reading time:
13 min
GoMining News
All news
April 21, 2026
🎉 GoMining Turns 5 — Join the 5 Years of GoMining Raffle!
April 20, 2026
TON APR Increased up to 14.6% in Simple Earn (Limited Time)
April 3, 2026
Swap Any 2 Any: Exchange crypto inside your GoMining wallet
March 31, 2026
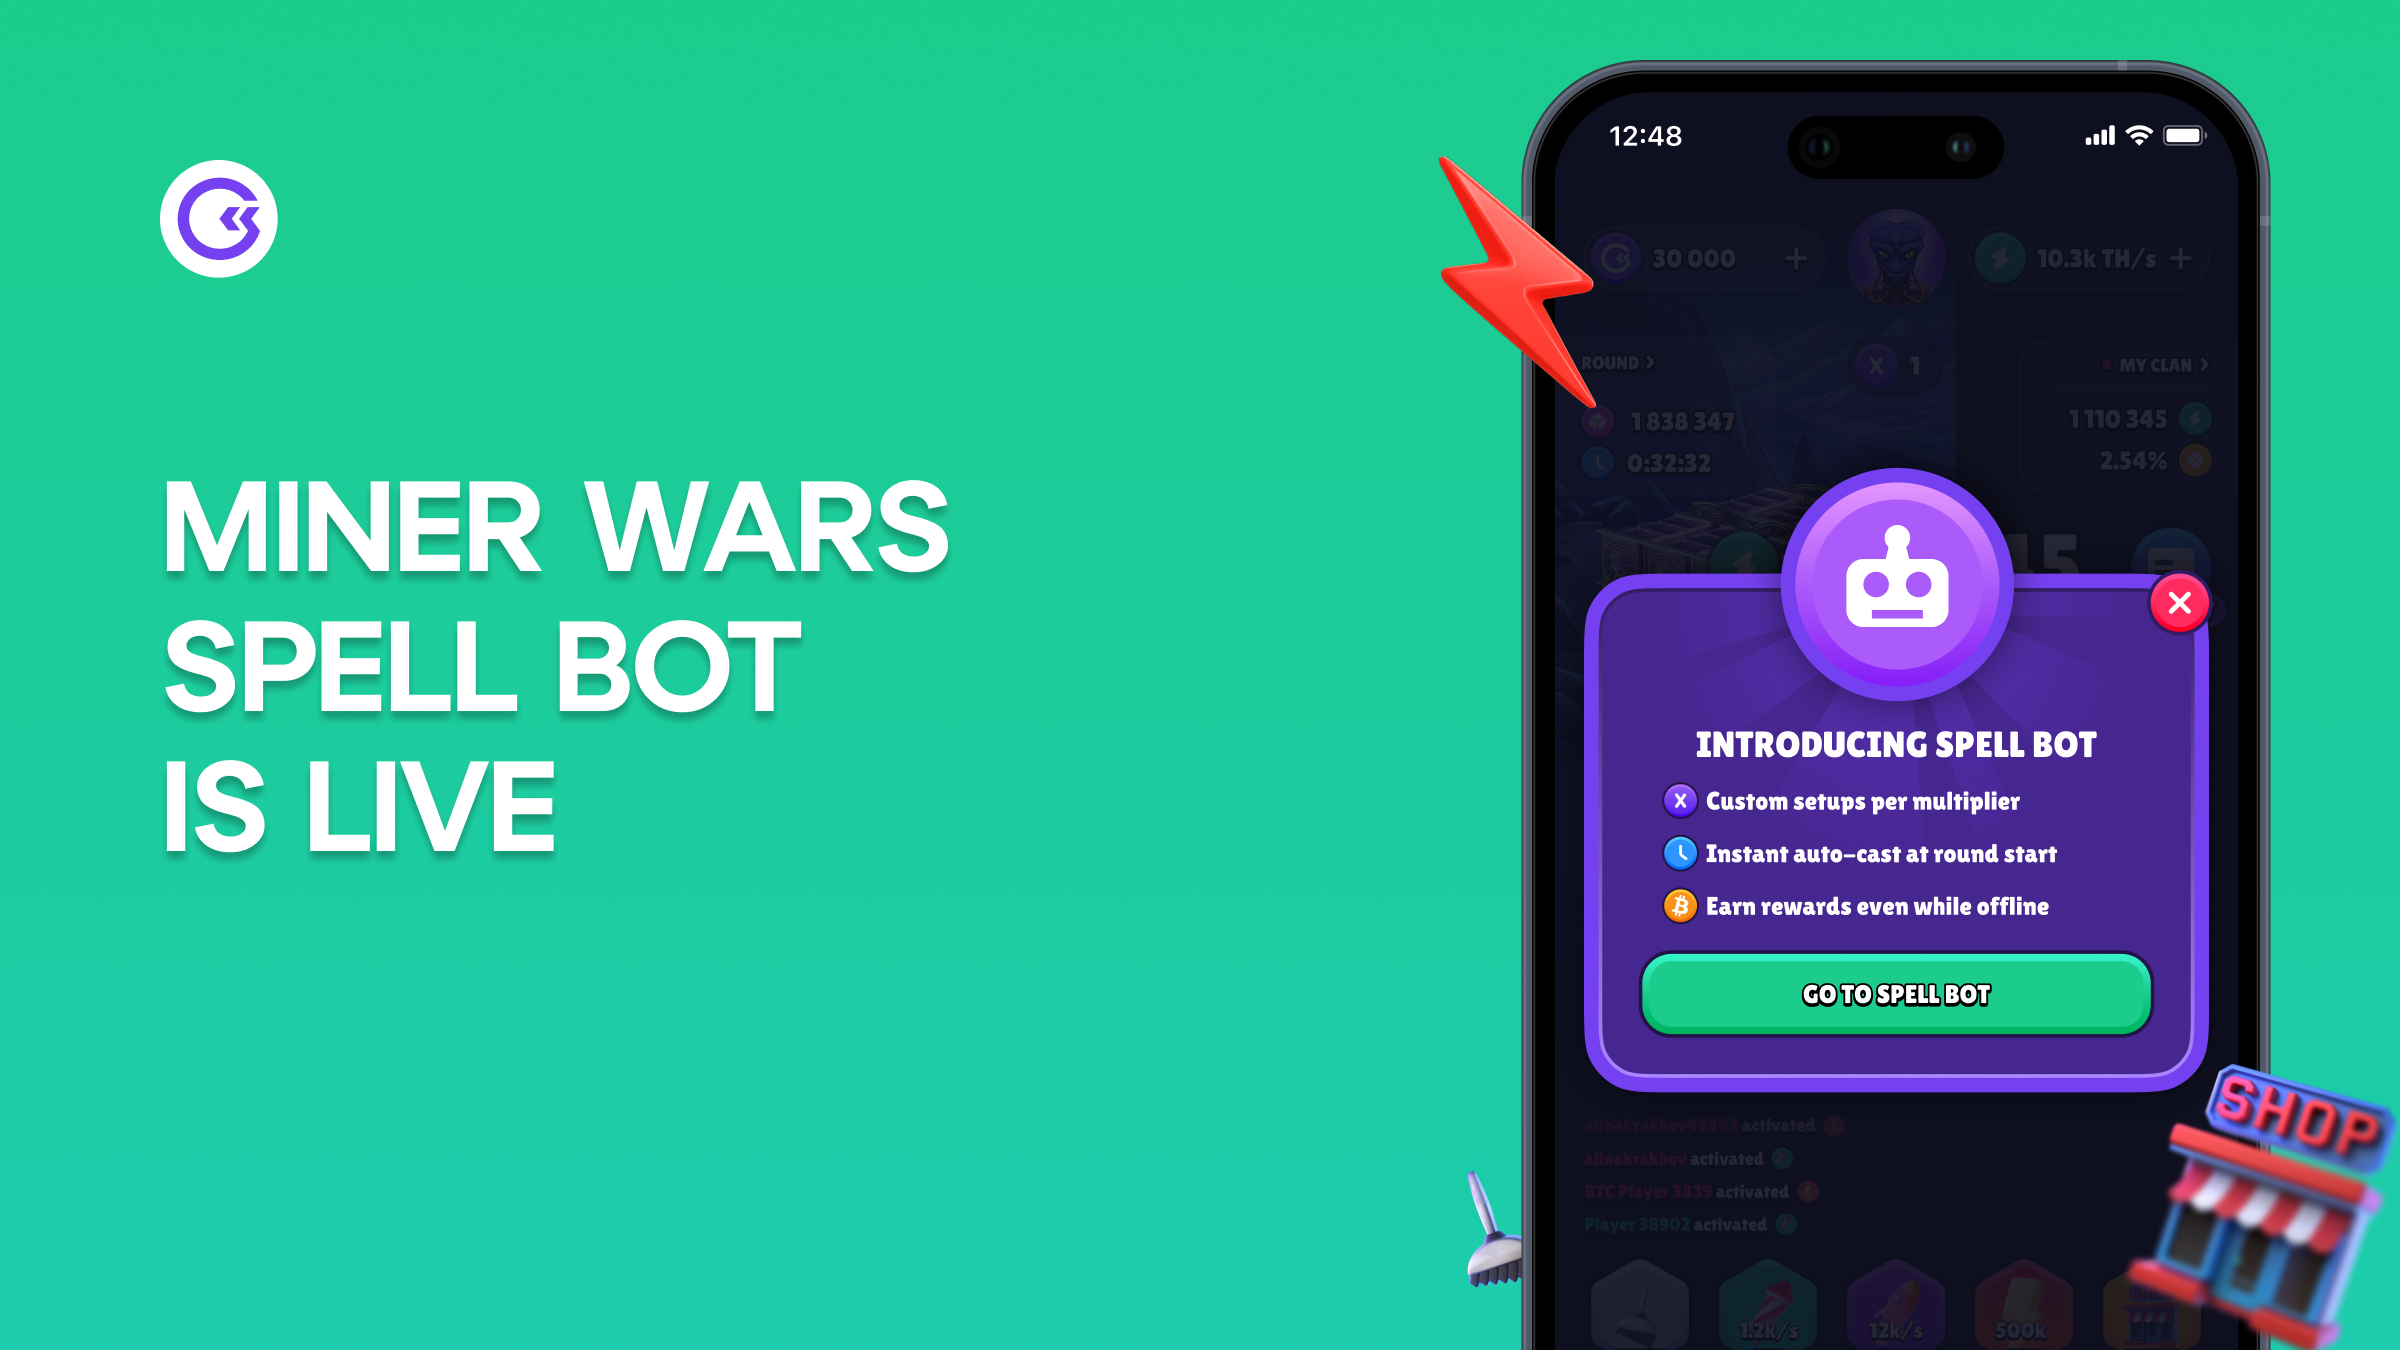
Spell Bot: Automate Your Miner Wars Strategy
March 30, 2026
Bonus Miner Upgrades: A Free Bitcoin Miner That Grows With You
March 26, 2026
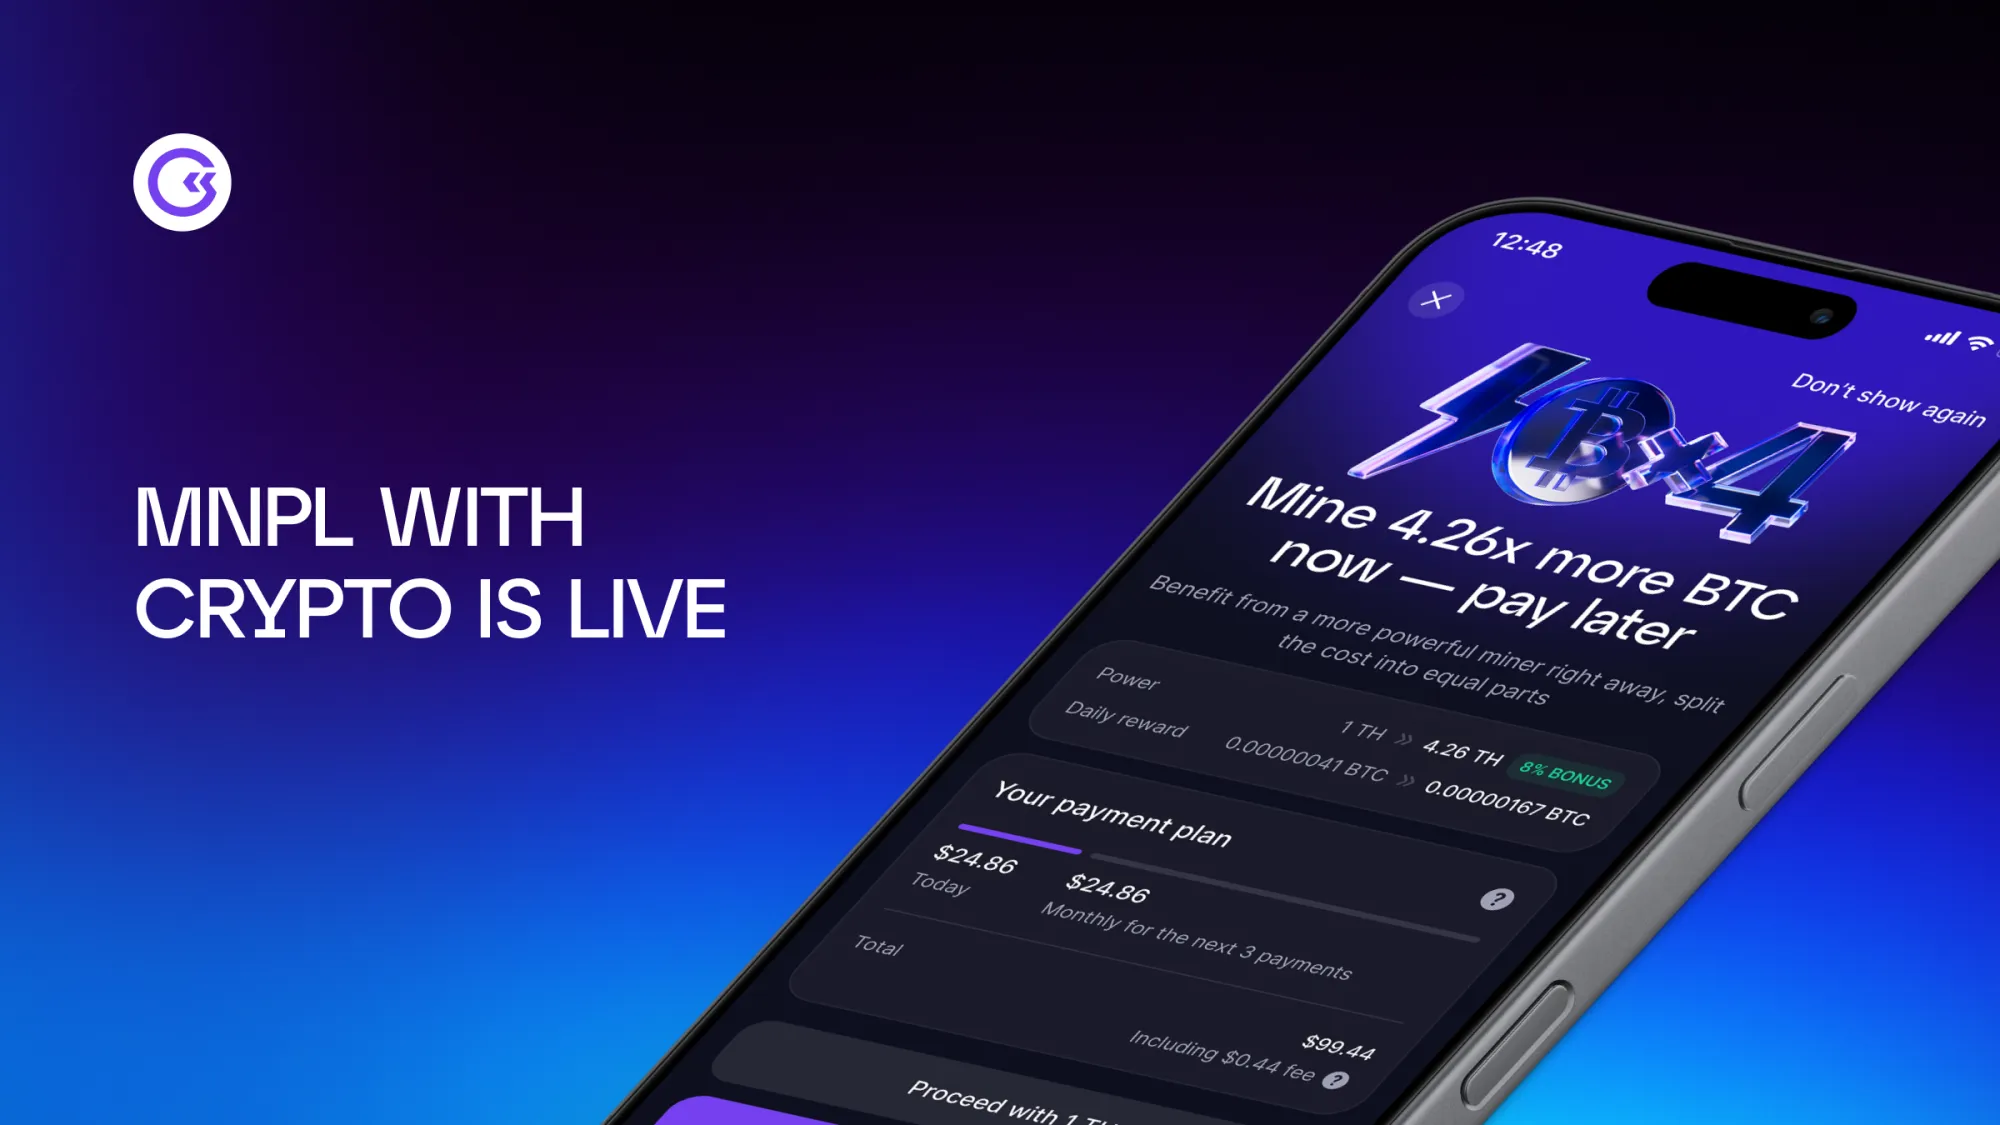
Mine Now, Pay Later Now Supports Crypto Payments
March 26, 2026
Bounty Epoch 6 Wraps Up: Community Momentum in Action
You might be interested in:
April 20, 2026
TON APR Increased up to 14.6% in Simple Earn (Limited Time)
January 24, 2026
Where Did Bitcoin Mining Come From? The History of Digital Gold
April 3, 2026
Swap Any 2 Any: Exchange crypto inside your GoMining wallet
February 26, 2026
Platinum+ Subscription: Unlock Platinum I VIP Benefits Without Climbing the VIP Ladder