Mining de Bitcoin
Mineurs Numériques
Gagnez des récompenses en BTC quotidiennement et sans effort
Calculer de récompenses
Estimez vos récompenses potentielles en BTC
Jeton GOMINING
Découvrez comment GOMINING augmente vos récompenses de minage
Miner Wars
Participez à des compétitions et gagnez des BTC et GOMINING
Portefeuille
Portefeuille
Achetez, envoyez et recevez des crypto en toute sécurité
Cartes de crypto
Payez avec des crypto en ligne et dans les magasins
Portefeuille Web 3.0
A venir
Finance
Simple earn
Gagnez des BTC sur vos cryptos sans blocage
Prêts
A venir
Launchpad
Accédez à des projets de crypto en phase de lancement
Voyage
Voyage
Réservez des hôtels et des vols dans le monde entier
eSIM
A venir
Apprendre
Académie
Découvrez gratuitement les cryptos étape par étape
Blog et actualités
Restez informé des dernières tendances et analyses
Aide aux clients
Trouvez des réponses rapides ou contactez notre équipe d'assistance
Glossaire des cryptos
Les termes clés des cryptos expliqués simplement
Programmes d'avantages
GoClub
Club exclusif pour les détenteurs d'avatars GoMiner
GoMiners
Possédez un avatar GoMiner et débloquez des avantages uniques
Programme de référence
Invitez vos amis et gagnez des récompenses supplémentaires
Programme VIP
Améliorez votre statut VIP et accédez à des avantages supérieurs
Entreprise
Généralités
À propos
Ce que représente GoMining et comment tout a commencé
Carrières
Travaillez avec une équipe crypto internationale
Contacts
Pour toute demande d'assistance ou de partenariat
La tokenomics
Structure, utilité et flux de jetons de GOMINING
Avis sur GoMining
Ce que des millions d'utilisateurs disent de GoMining
Pour les partenaires
Comité consultatif
Des experts qui guident la vision à long terme de GoMining
Rapports et résultats
Rapports de transparence et mises à jour des performances
Prestataires de services
Partenaires d'infrastructure de confiance
Institutional
Solutions de minage de Bitcoin de niveau institutionnel
S'inscrire
Se connecter
Se connecter
S'inscrire
FR
Vous avez quitté l'univers GoMining
Il n'y a rien ici - pas de jetons, pas de blocs, pas même de poussière d'étoiles. Revenons à la base
Retour à la maison
GoMining News
Toute l'actualité
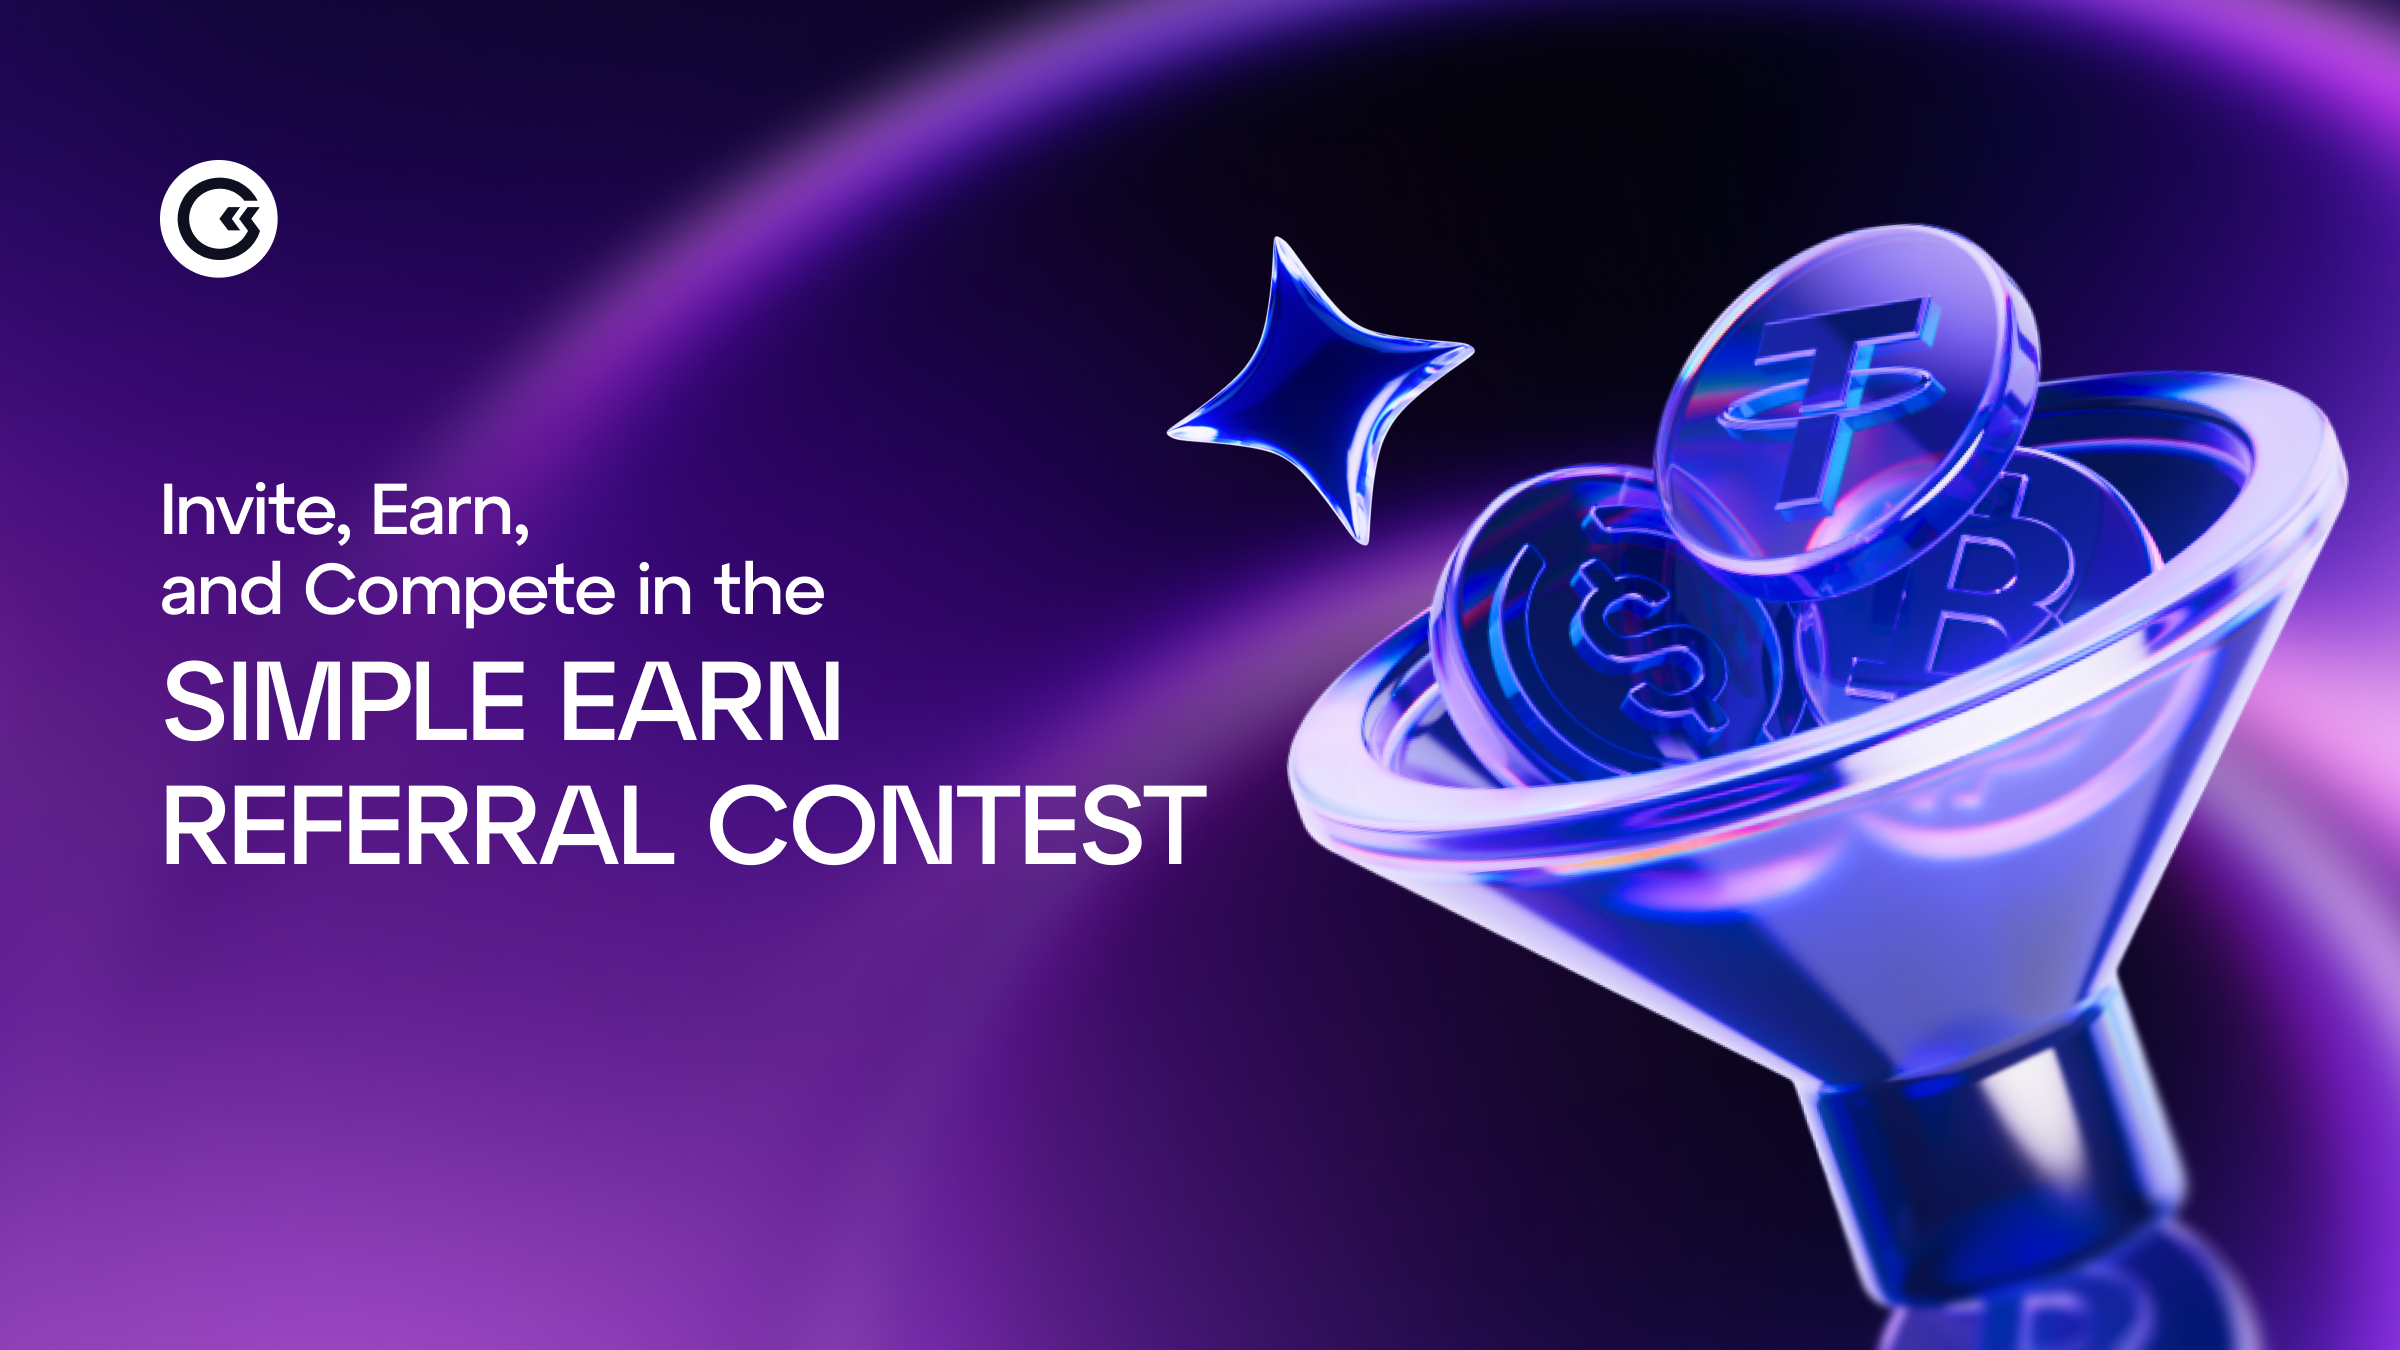
March 20, 2026
Concours de parrainage Simple earn : Gagnez une part de 100 000 GOMINING
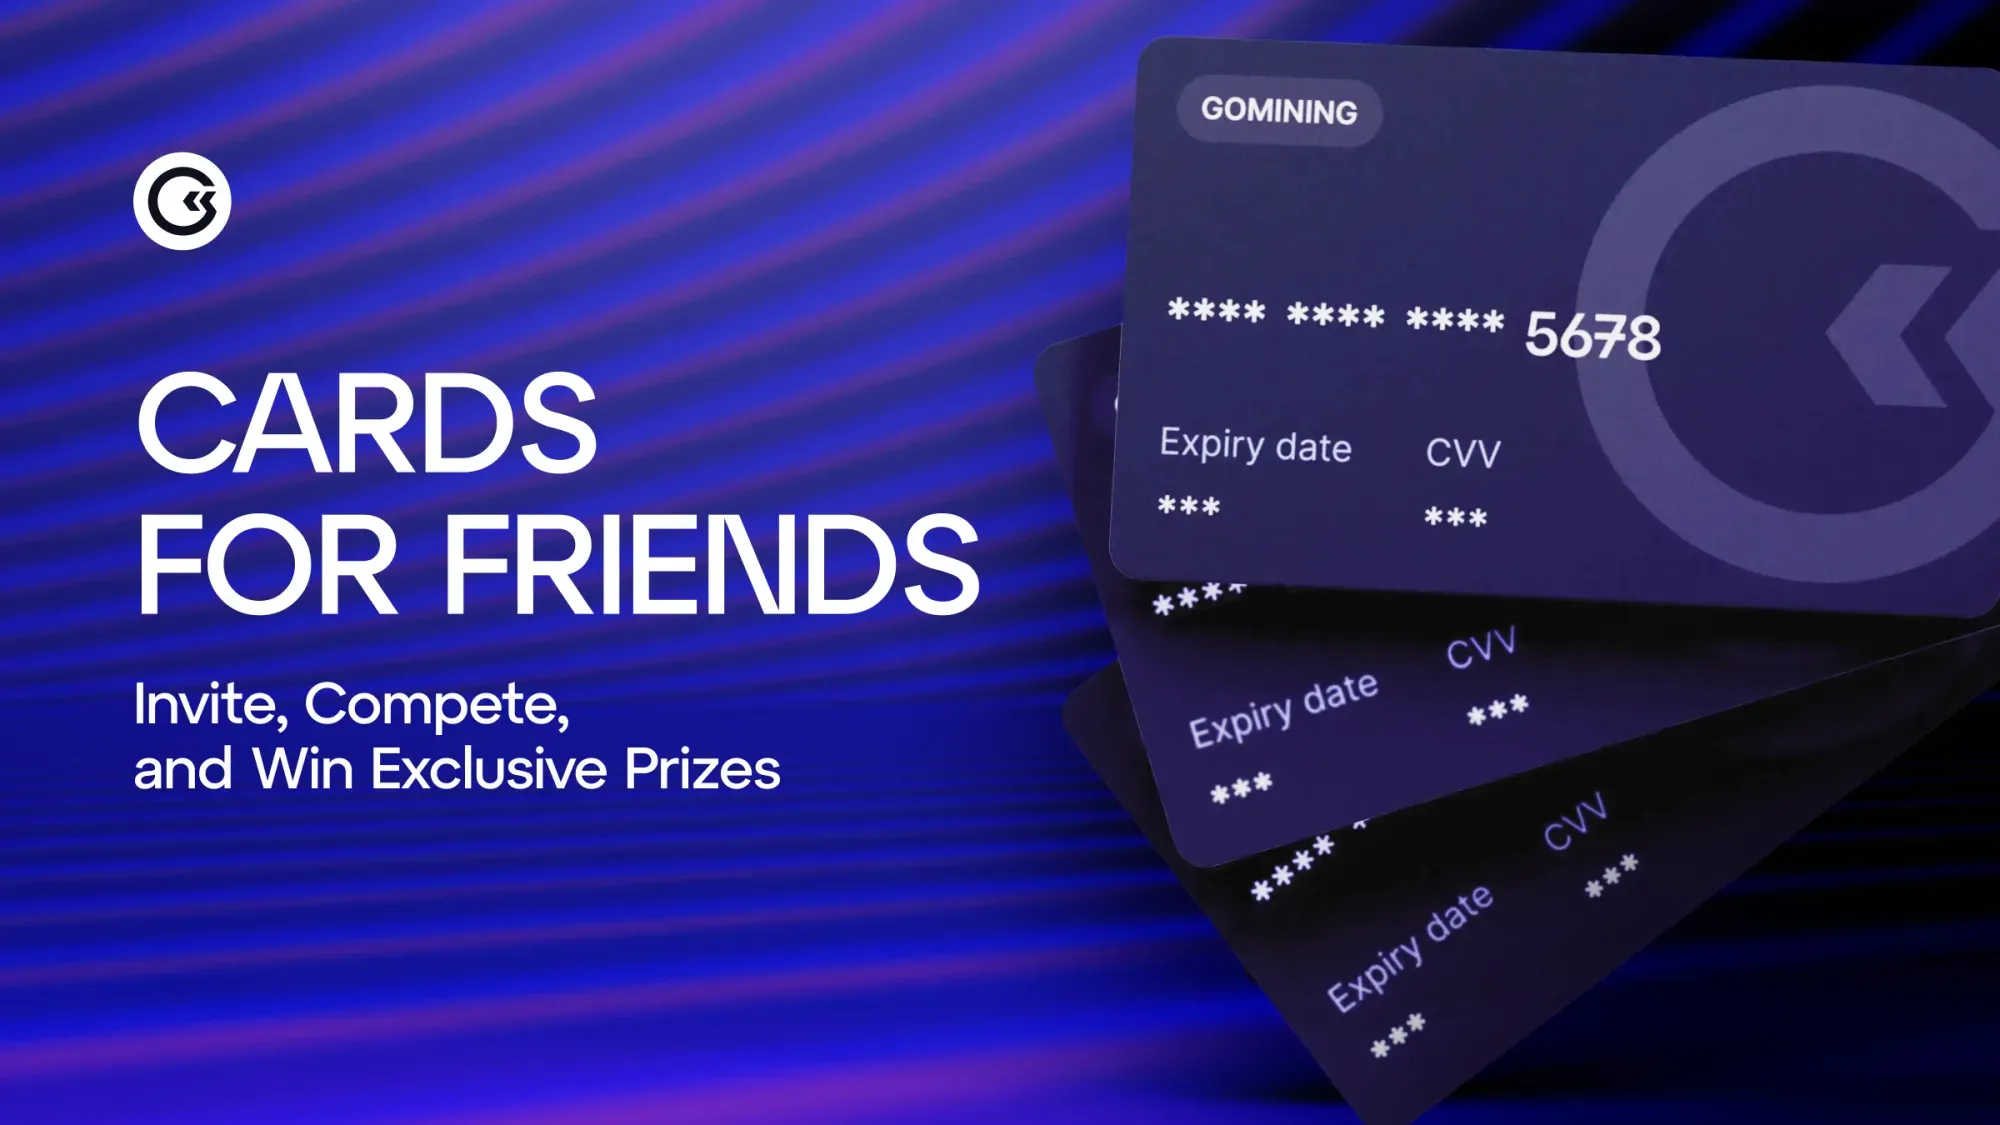
February 10, 2026
Cards for Friends : invitez vos amis, débloquez des récompenses et gagnez des prix
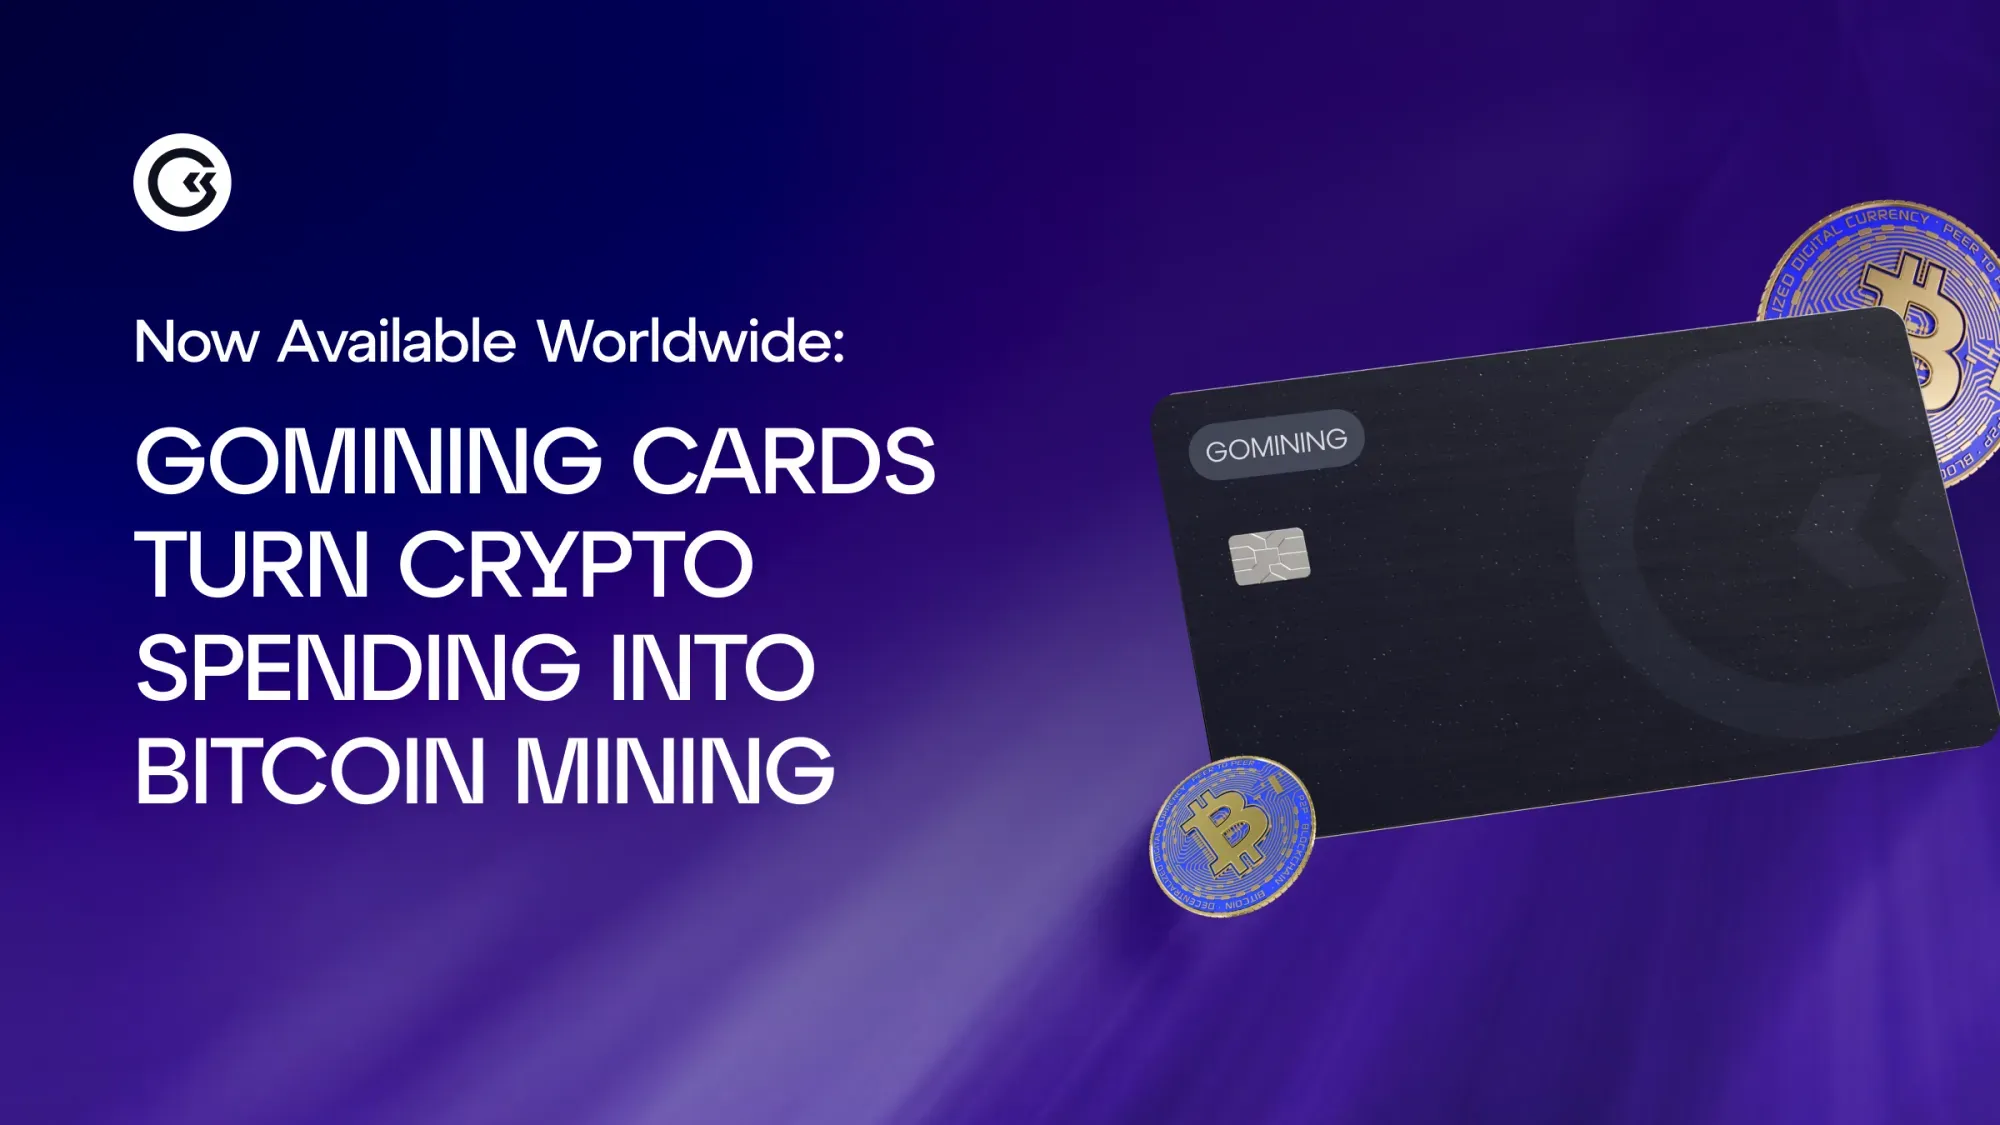
February 10, 2026
Extension des cartes GoMining — désormais disponibles dans plus de 130 pays
February 6, 2026
Restez forts. Croyez en Bitcoin
February 6, 2026
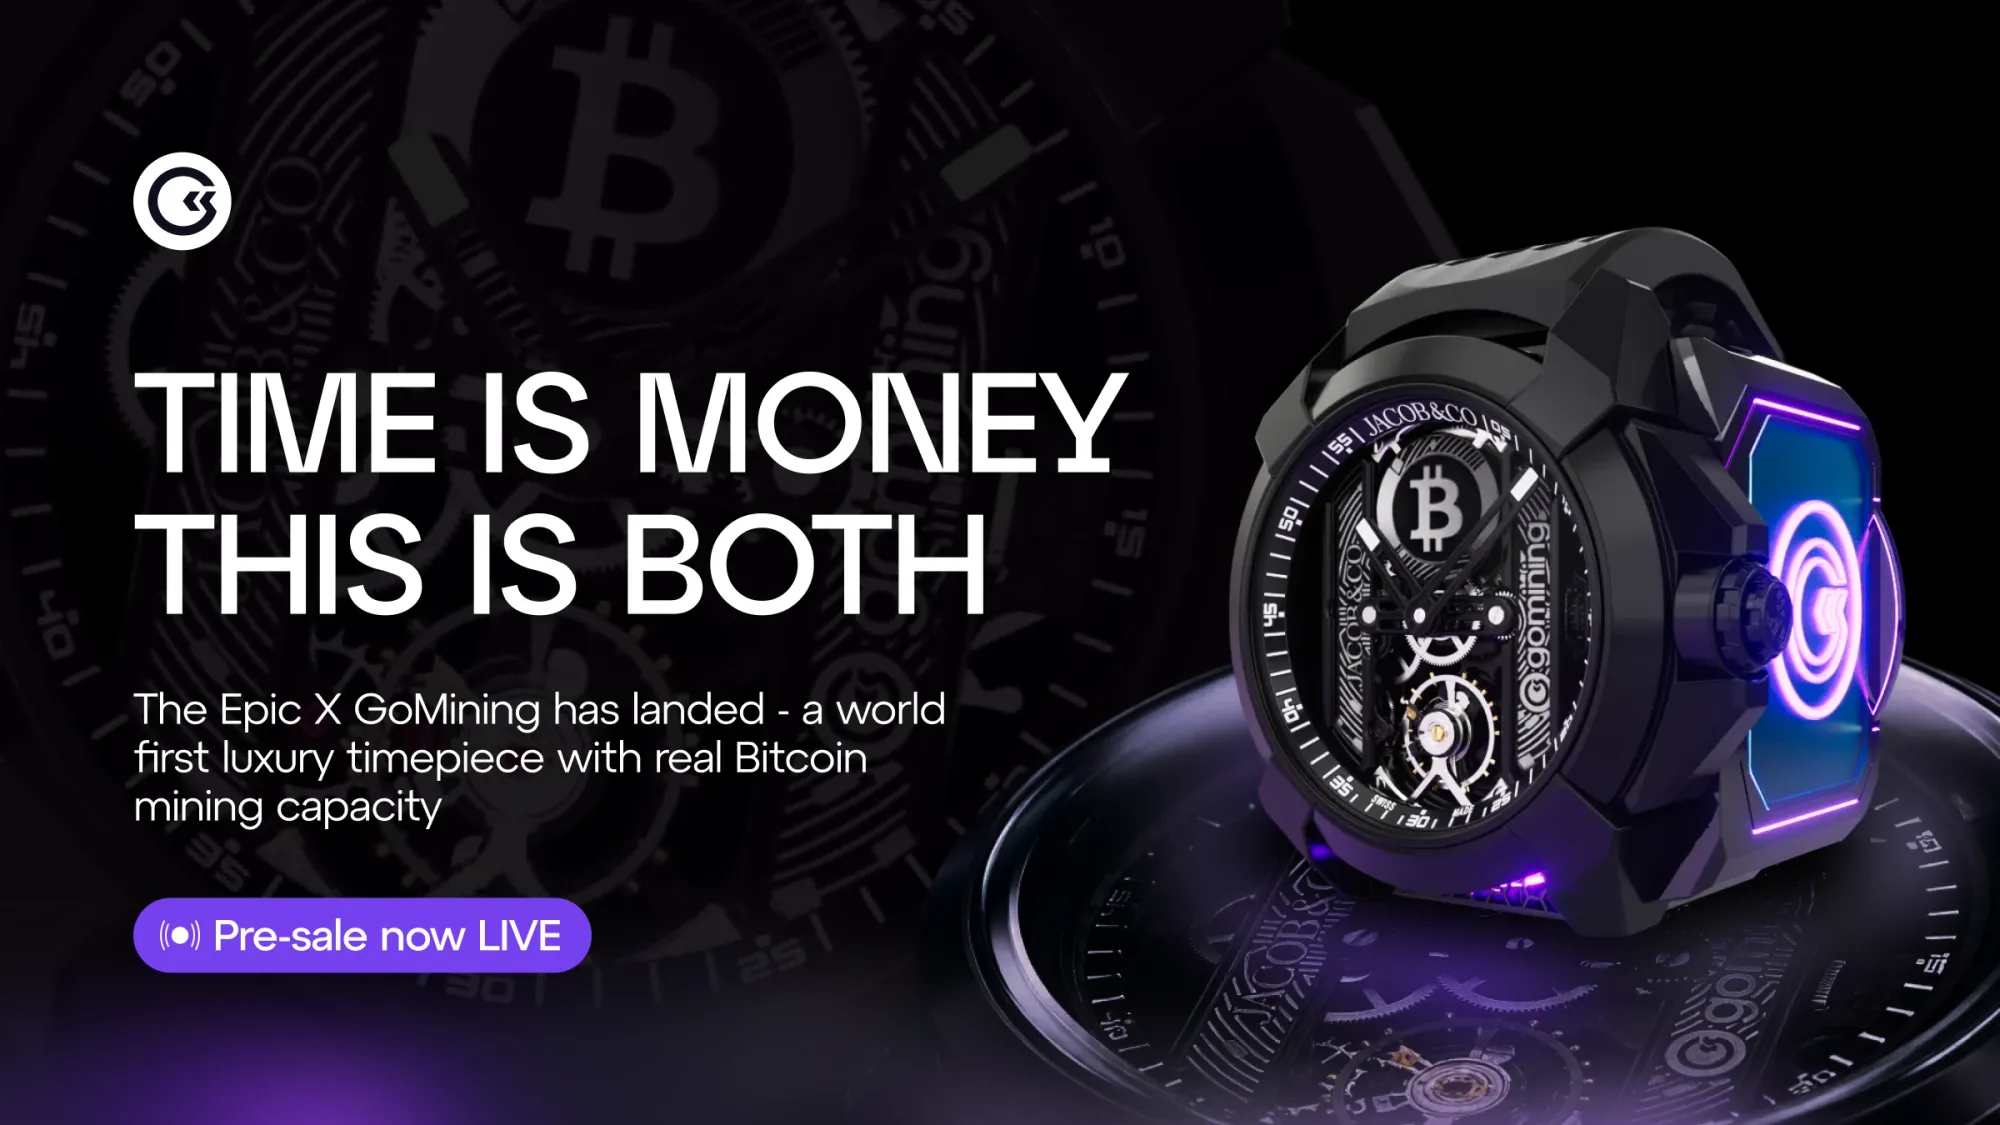
Epic X GoMining : les commandes sont désormais disponibles sur le GoMining Marketplace
February 5, 2026
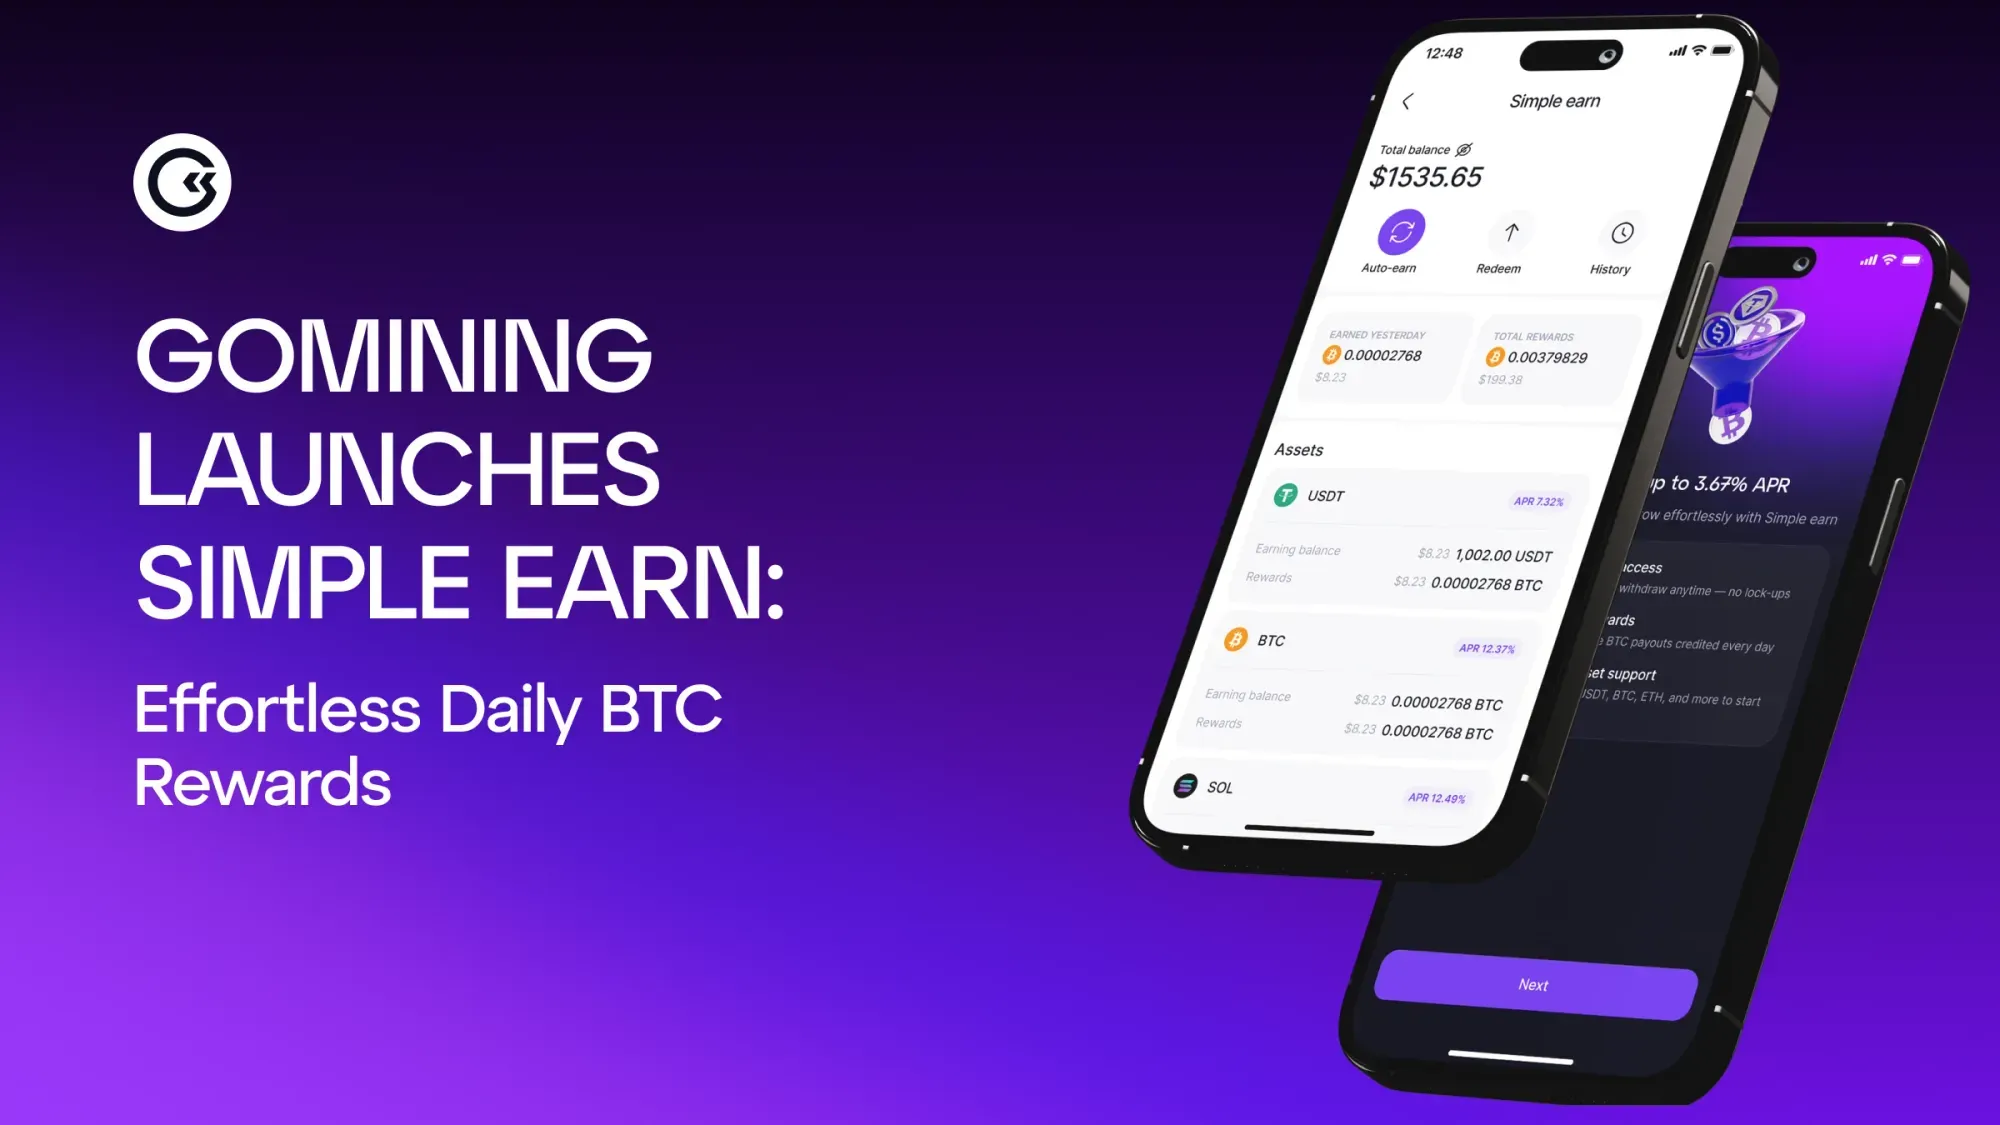
Simple Earn est disponible — Générez un rendement en Bitcoin à partir de vos crypto-actifs inutilisés
February 3, 2026
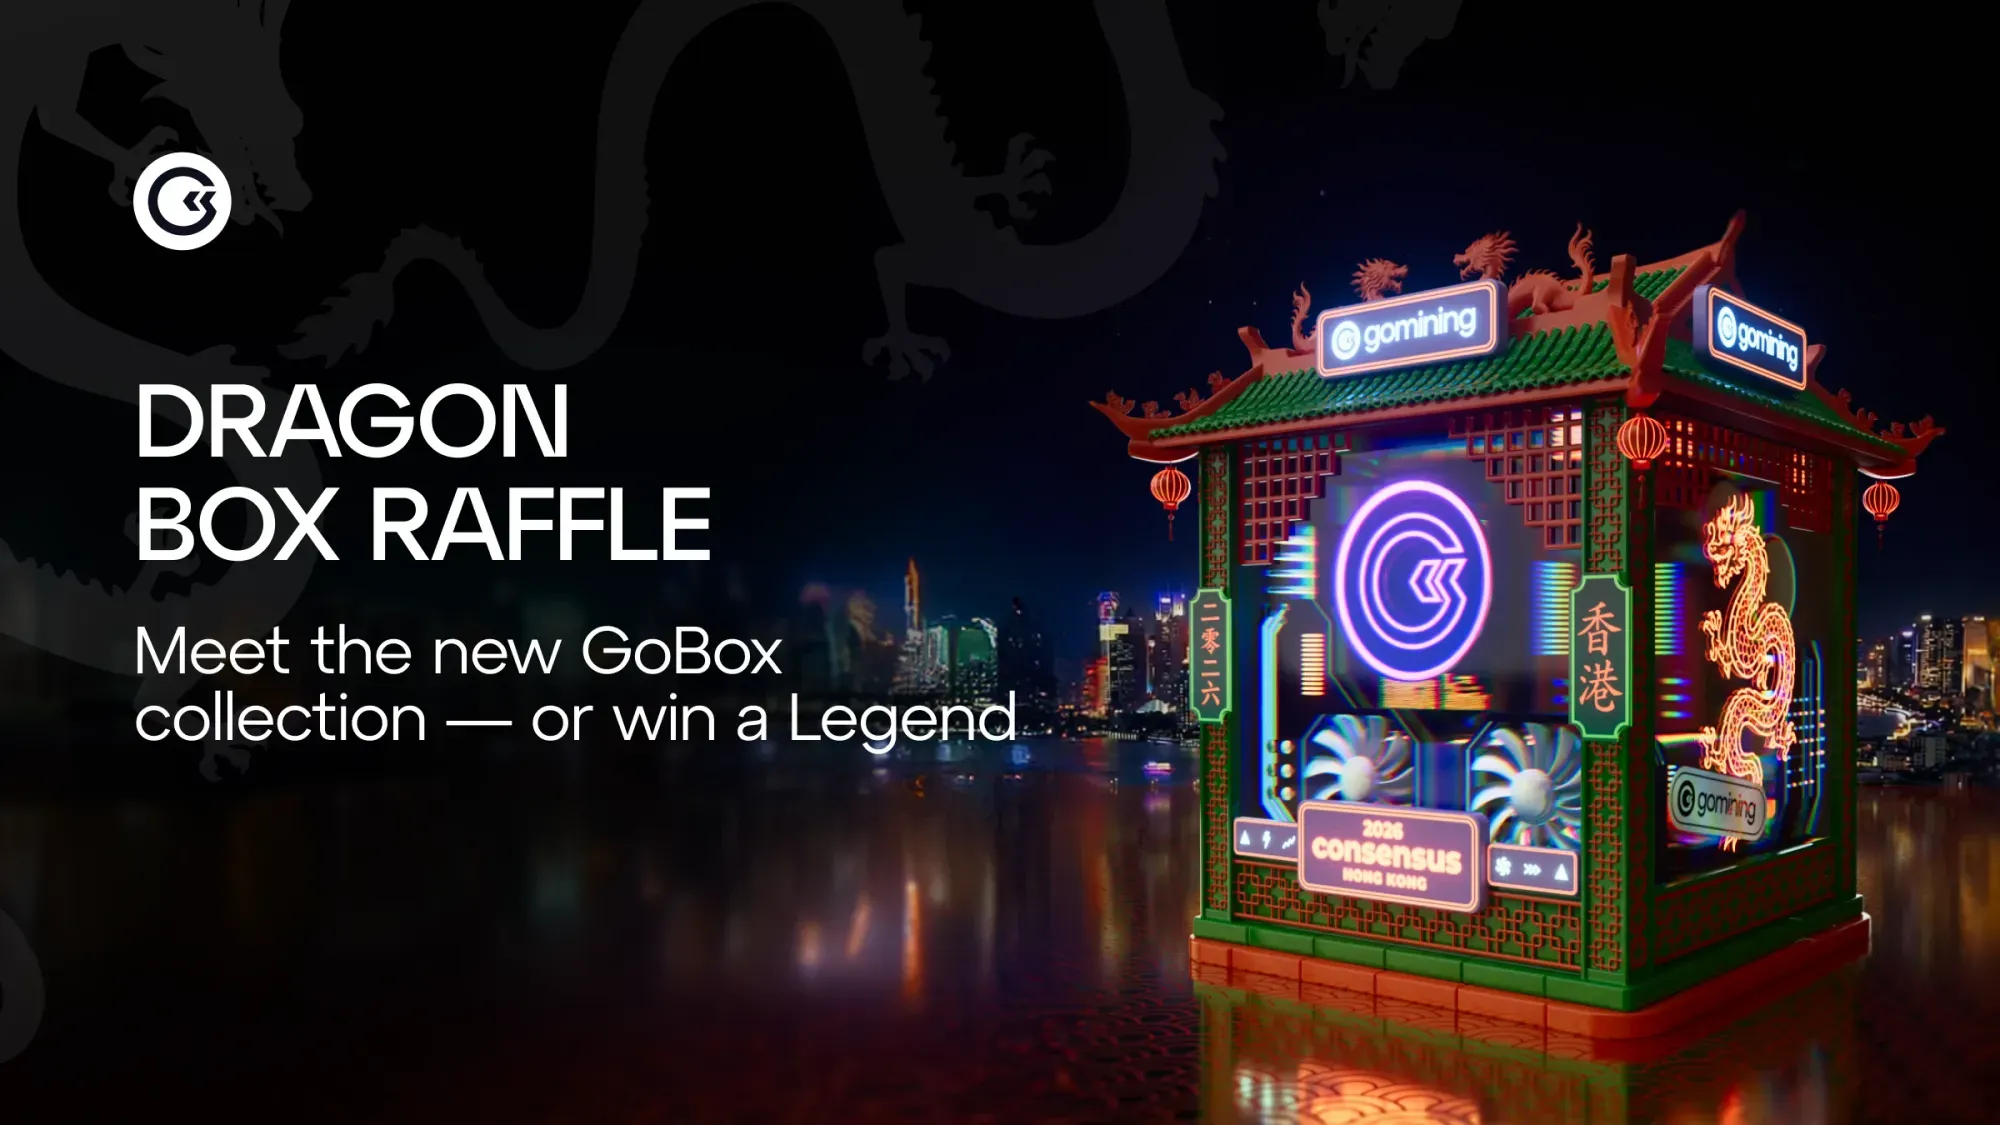
Dragon Box Raffle : découvrez une nouvelle génération de GoBox
Vous pourriez être intéressé par :
December 16, 2025
Staking Ethereum (ETH) : de 0 à investisseur on-chain
January 26, 2026
La mission de GoMining : libérer tout le potentiel du Bitcoin pour tous
December 26, 2025
Comment la décentralisation empêche l'effondrement du marché des cryptomonnaies
December 2, 2025
Comment comparer le hashrate de différentes blockchains?