
The cryptocurrency market is no longer driven by chaotic impulses from speculators — it is maturing, developing infrastructure, and beginning to follow a recognizable logic. In 2025, capital flows in digital assets stopped being a lottery: behind the noise of headlines and the volatility of charts, stable patterns emerge that can be read, understood, and used.
This is not just another bull market where everything grows at once. Money now flows selectively: from Bitcoin to altcoins and back, from speculative meme tokens into infrastructure projects, from centralized exchanges into DeFi protocols and staking. Institutional investors bring ETFs and regulatory clarity, retail traders are learning on-chain analytics, and developers are building new blockchain layers, each competing for its share of liquidity.
Understanding these flows — money flows — is becoming a key skill. Not guessing where the price will jump tomorrow, but seeing where billions of dollars are systematically moving; not chasing hype, but recognizing a fundamental shift in capital allocation.
There are no magical formulas for quick wealth here, but there is a systematic approach to a market that has stopped being the Wild West and has begun transforming into a complex but knowable ecosystem.
It does not matter whether you hold your first few hundred dollars in Bitcoin or manage a portfolio of DeFi positions — understanding where and why money flows in crypto will change the way you view this market.
What Is “Money Flow” in Crypto and Why 2025 Is Special
The first important thing to understand: by “money flow” we mean real capital flows — for example, when large investors move funds onto exchanges or withdraw them, when money arrives through ETFs, or when capital is transferred through DeFi protocols. These movements are reflected in on-chain data (token movements on the blockchain), exchange data (inflows/outflows), and institutional products (ETFs, funds) — all together forming patterns. In 2025, such flows become more significant for two reasons:
Institutional capital — via products such as spot ETFs — is beginning to play a major role. For example: U.S. spot Bitcoin ETFs alone have already attracted more than $130 billion:
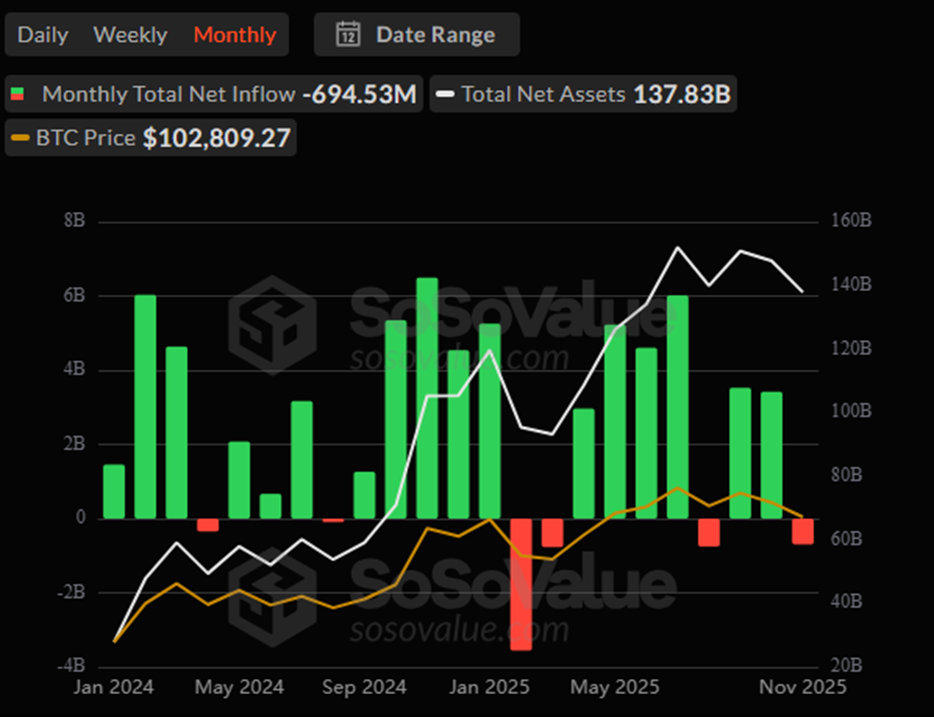
Source: sosovalue.com
On-chain analytics is becoming more powerful: platforms like Nansen make it possible to analyze wallets, large transactions, and exchange flows, enabling the tracking of “smart money” behavior.
Thus, we are entering a period when money flow patterns become visible in advance — and therefore available for analysis and practical application.
Main Money Flow Patterns in 2025
The 2025 crypto market demonstrates several stable capital-flow patterns that can be used to understand market dynamics. Let’s examine them in order, from the largest to the more subtle signals.
Institutional Money via ETFs
The launch of spot ETFs for Bitcoin and Ethereum in 2024 changed the nature of capital flows into crypto. Now pension funds, family offices, and traditional investors can enter crypto through familiar brokerage accounts, without dealing with private keys or wallets.
This creates a clear relationship: when institutional money flows into ETFs, they effectively buy Bitcoin and Ethereum from the market, but these coins do not return to circulation — they settle in the accounts of custodians such as Coinbase Custody. This creates a shortage on the spot market and upward pressure on price.
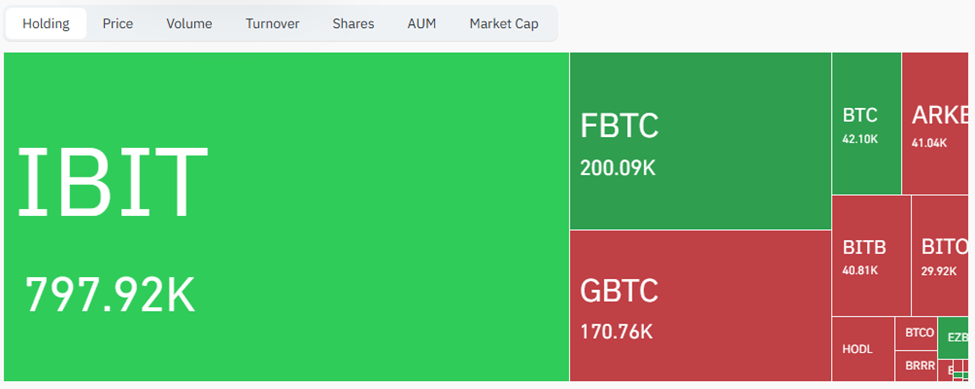
Source: coinglass.com
Studies show that the correlation between ETF inflows and the Bitcoin price is about 0.73, which is statistically significant. Practically, this means: if you see steady weekly inflows into Bitcoin ETFs, it signals that buying pressure is building.
Where to track:
Whale Movements and Exchange Flows
When large volumes of Bitcoin or Ethereum leave exchanges for cold wallets, this is traditionally interpreted as accumulation before a rise.
The logic is simple: if a large player withdraws coins from an exchange, they are not planning to sell them soon. Supply shrinks, demand remains — price rises.
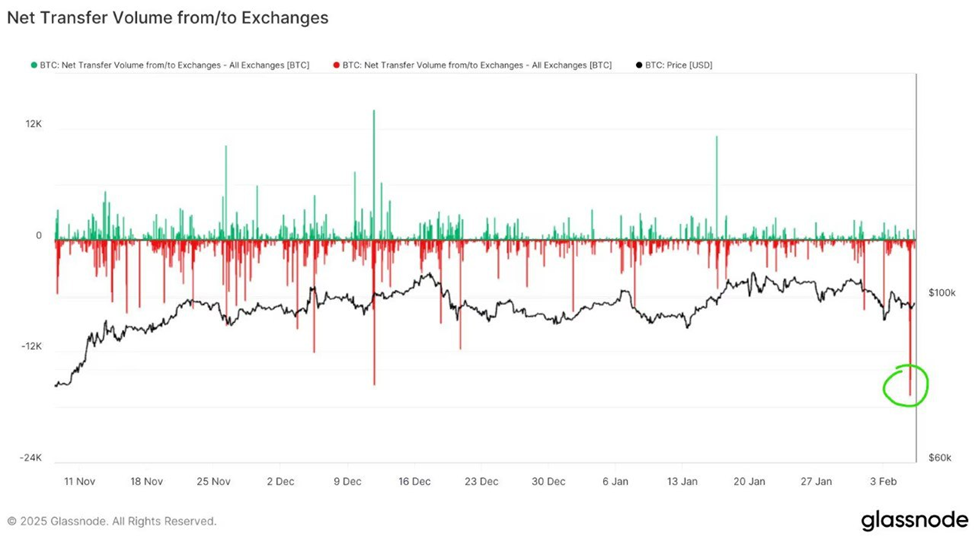
Source: studio.glassnode.com
The Nansen platform specializes in tracking such movements, labeling wallets by owner type — from venture funds to individual whales. Their methodology focuses on three data types: • movements of “smart money”, • exchange inflows/outflows, • stablecoin movements that often precede large purchases.
The opposite signal also works: large transfers to exchanges usually indicate an intent to sell. When whales send tokens to Binance, Coinbase, or Kraken, this often precedes a correction.
Signals are not absolute — a whale may be moving funds to use staking or other products — but statistically, the pattern is stable.
Additional tools:
- Arkham Intelligence — ETF wallets and large transfers
- Glassnode — daily balance of CEX coin holdings
DeFi, Staking, and the TVL Metric
Decentralized finance in 2025 remains an important indicator of where capital flows within the crypto ecosystem. TVL (Total Value Locked) — the total value of assets locked in DeFi — serves as a barometer of trust.
According to CoinGecko, total crypto market cap reached $3.5 trillion in Q2 2025, with Bitcoin dominance at 59%. This means about 41% of capital is spread across altcoins, many of which participate in DeFi:
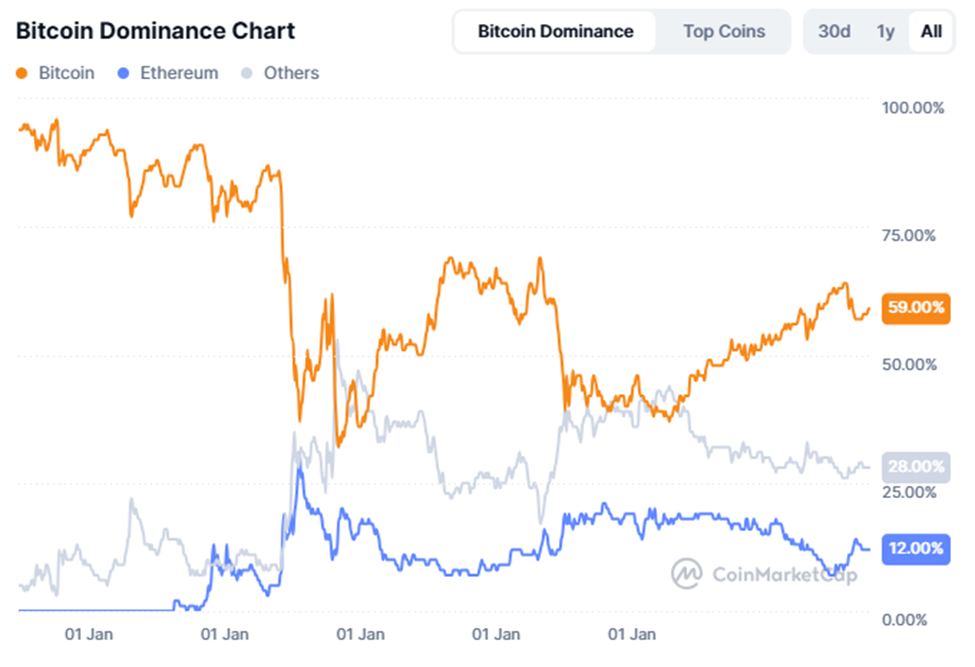
Source: coinmarketcap.com
TVL growth in a particular ecosystem (Ethereum, Solana, BNB Chain, etc.) usually signals increasing capital inflow. New staking products, lending protocols with attractive yields, and liquid staking derivatives all create points of attraction for money.
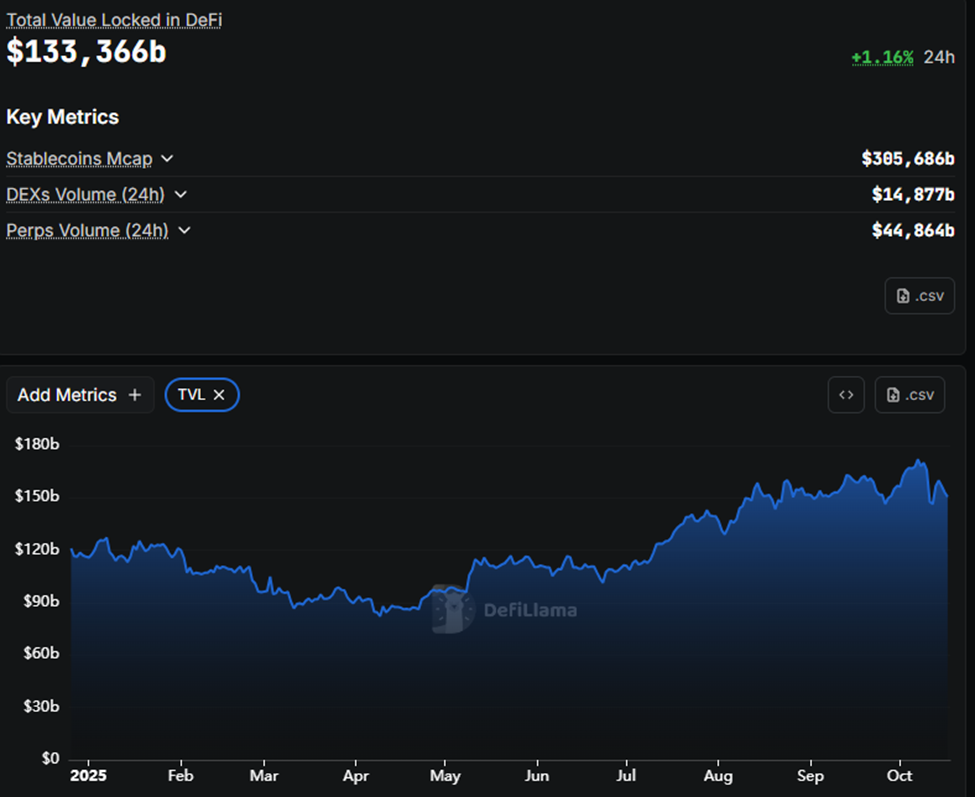
Source: defillama.com
However, caution is essential: high yields in DeFi often compensate for high risk. Before following capital into a new protocol, check audits, the team’s history, and the sustainability of its business model.
Where to track:
Micro-Cycles and Liquidation Cascades
Even during growth periods, the market experiences sharp corrections driven by the buildup of leveraged positions. October 2025 gave a clear example: despite record ETF inflows, the market saw a liquidation wave totaling around $19 billion.
Traders, encouraged by rising prices, open leveraged positions. When price drops sharply, exchanges forcibly close these positions, creating selling pressure and amplifying the fall.
This pattern reminds us that even strong capital inflows do not cancel short-term volatility. It is crucial to track open interest on futures: when it grows too quickly while price rises, risk increases.
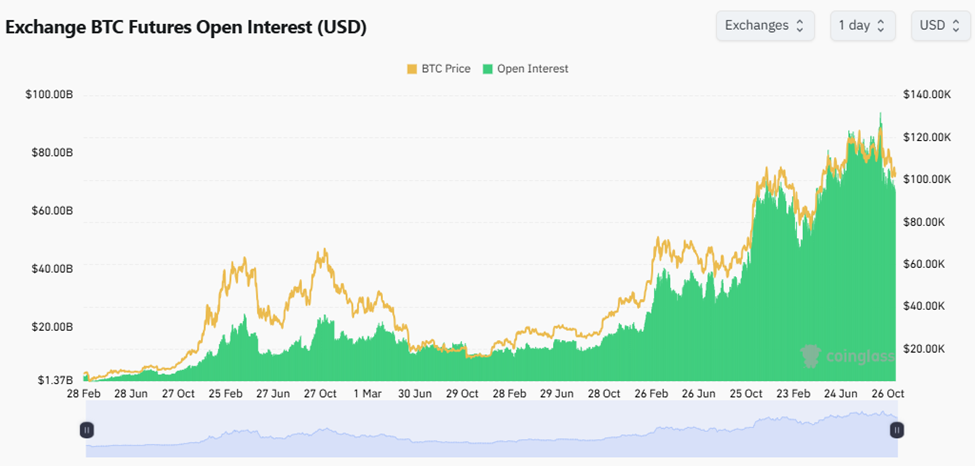
Source: coinglass.com/BitcoinOpenInterest
Where to track:
- CoinGlass — real-time liquidations and open interest
Capital Rotation: From Bitcoin to Altcoins
One of the core patterns: cyclic movement of money between Bitcoin and altcoins. In bull cycles, capital first accumulates in Bitcoin.
Once Bitcoin slows down (price stabilizes, narrative cools), investors begin seeking higher returns in altcoins. Analysts note that in 2025 institutional ETF flows form the basis for this rotation: BTC → ETH → large altcoins (Solana, Cardano, DeFi).
If Bitcoin has grown significantly and altcoins lag behind — this may signal rotation into alts.If altcoins grow faster than Bitcoin — this often signals the cycle’s end.
How to Use These Patterns in Practice
Step 1: Choose Tools and Data
You need tools to track flows, on-chain data, and ETF inflows:
- Nansen — smart money, exchange flows
- Arkham Intelligence — ETF wallets, inflows/outflows
- DeFiLlama — TVL, altcoins, DeFi
- CoinGecko — market stats
- CoinGlass — open interest and liquidations
Tip: create a dashboard or spreadsheet with key metrics: ETF flows, exchange flows, TVL changes, large wallet behavior.
Step 2: Watch for Signals
Look for:
- Significant ETF inflows
- BTC/ETH withdrawals from exchanges (shrinking liquidity)
- TVL growth
- Changes in BTC dominance
- Whale activity: accumulation, reinvestment, movement to cold storage
- Risk signals: large inflows to exchanges, record open interest, spikes in liquidations
Step 3: Decision-Making
- ETF inflows + exchange outflows + TVL growth → accumulation signal
- Exchange inflows + ETF outflows + TVL drop → reduce exposure / take profits
- After BTC accumulation, consider rotating into altcoins or DeFi (only with confirmation)
- Always use stop-losses
Step 4: Efficiency Metrics and Scenarios
Track:
- Asset performance after pattern onset
- BTC dominance shifts
- Altcoin returns after rotation
A commercial scenario: ETF inflows + reduced exchange liquidity → gradual BTC entry → saturation signal → rotation into altcoins.
Don’t put all capital in one asset or strategy. Diversification and risk management are essential.
Connection With ETFs, DeFi, and Regulation
ETFs and Institutional Flows
Spot BTC and ETH ETFs changed the market structure. Such flows show persistence — unlike one-time whale moves.
Regulatory greenlights reduce risk and increase inflows.
The ETF market is expanding (alt ETFs, RWAs, etc.).
DeFi, Staking, and TVL
TVL growth reflects increasing capital allocation. But protocols must be secure and sustainable.
Regulation and Market Cycles
Macro and regulation strongly affect crypto. A major event (rate cut, new rules) can shift patterns instantly. In October 2025, heavy ETF inflows did not prevent a correction.
Patterns must be viewed in macro context.
Trends for 2025–2026 and Forecasts
What to Expect
- Expansion of spot ETFs — BTC, ETH, XRP, etc.
- Rising institutional share — companies adding crypto to balance sheets
- Growth of RWA tokenization and DeFi integration into TradFi
- Clearer cycle phases: BTC first → altcoins
- Growing importance of on-chain analytics
Possible Scenarios for 2026
- Optimistic: ETF flows + on-chain accumulation → new growth wave; altcoins surge after BTC saturation
- Base case: growth continues but slowed by macro/regulation
- Conservative: ETF flows slow, patterns weaken
Investors must prepare for all scenarios with proper risk management.
FAQ
What are 2025 money flow patterns in crypto?
Recurring capital movement patterns (ETF flows, on-chain flows, DeFi activity) visible in 2025.
How do these patterns affect the crypto market?
They create advance signals: ETF inflows push prices, exchange outflows reduce liquidity, exchange inflows indicate correction risk.
How to use these data for analysis?
Monitor ETF flows, exchange flows, TVL, smart money; compare with patterns; decide when to enter, hold, exit.
Tools for tracking?
Nansen, Arkham, DeFiLlama, CoinGecko, CoinGlass.
Risks?
Patterns can break due to macro/regulation; capital flows aren’t guarantees; liquidity may disappear; leverage increases vulnerability.
What do analysts say?
ETF flows have become a new structural factor changing market dynamics.
Common beginner mistakes?
Ignoring macro context, entering without confirmation, skipping stop-losses, ignoring liquidity and derivatives risk.
Connection with ETFs and DeFi?
ETF flows restrict circulating supply; DeFi accumulation reduces liquidity; both together shape capital movement.
Can you profit from these patterns?
Yes, with discipline. But risk remains. No autopilot.
Forecast for 2026?
ETF expansion, institutionalization, RWA growth, altcoin rotation — but patterns may weaken as they become widely known.
Conclusion
Money flow patterns in crypto in 2025 are becoming a real analytical tool — not only for traders but also for long-term investors. Key patterns include ETF inflows, on-chain movements, DeFi/TVL growth, altcoin cycles, and liquidity risks.
Beginners should choose reliable tools, monitor regularly, stay disciplined, and account for macro and regulation. Profit potential exists, but only with a competent approach.
To build fundamentals, start with the free course “Crypto from Zero to Advanced Investor”: https://academy.gomining.com/courses/bitcoin-and-mining
Telegram | Discord | Twitter (X) | Medium | Instagram