
Crypto mining today is not just a block production technology, but the nervous system of the entire crypto industry. Following the Bitcoin halving in April 2024, Ethereum's transition to Proof-of-Stake, and a new wave of regulation in the US and EU, the market has entered a stage that analysts call the era of "smart mining".
According to the Cambridge Centre for Alternative Finance, the total Bitcoin network hashrate in October 2026 exceeded 1000 EH/s—a first in history. At the same time, Bitcoin itself is storming the $110 000 mark, and miner profitability is rising again after a year and a half of stagnation. But behind the dry figures are processes that show where a new cycle truly begins.
Why Mining Metrics Matter
For an investor, analyst, or even a trader, understanding what is happening "under the hood" of the network often provides an advantage over the market for weeks or months. Hashrate, mining difficulty, profitability, and miner behavior are not just technical parameters. They are the market temperature. When hashrate grows, it means money is returning to the ecosystem, equipment is being updated, and competition is intensifying. When it falls, miners are capitulating, and this often coincides with local price bottoms.
Hashrate: The Network's Pulse and an Indicator of Trust
Hashrate is the aggregate computational power that ensures the blockchain's operation. Currently, according to Blockchain.com, the indicator has surpassed 1,000 EH/s—double the value of a year ago. This explosive growth was ensured by new generations of ASIC devices, such as the Antminer S21 Hydro and Whatsminer M66, which yield up to 350 TH/s with an energy efficiency of 15 J/TH. Historically, hashrate growth precedes Bitcoin's price increase by approximately 2–4 months.
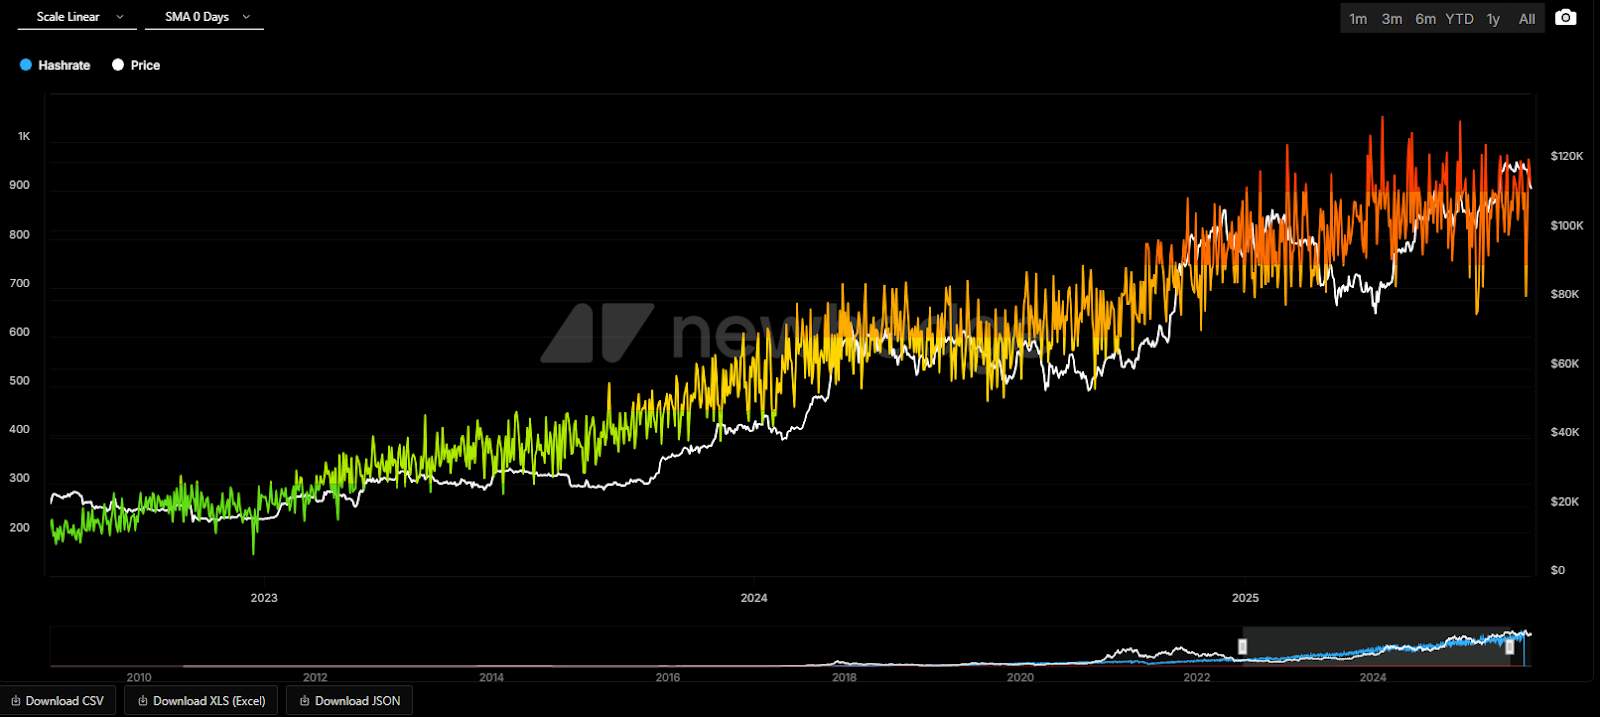
Miners begin to power on equipment when they sense a sustained trend and cheap electricity. This was the case in 2020 and 2023—and the same pattern is observed now.
Mining Difficulty and Network Balance
Bitcoin network difficulty is automatically recalculated every 2016 blocks (roughly once every two weeks). In 2026, it continues to break records, surpassing 93 T according to CoinMetrics. This means the network remains stable and can cope with the growth of computational power. Interestingly, the correlation between difficulty and BTC price remains high—around 0.7. Sharp drops in difficulty (minus 10–15%) are a rare but strong signal of miner capitulation and often a precursor to market recovery.
Miner Revenue and the Share of Fees
Following the 2024 halving, the block reward dropped to 3.125 BTC, but fees compensated for some of the losses. In 2023, they accounted for 10–15% of revenue, and in 2024 — up to 40% during periods of network congestion (spikes in activity from Ordinals, BRC-20 tokens, and microtransactions).
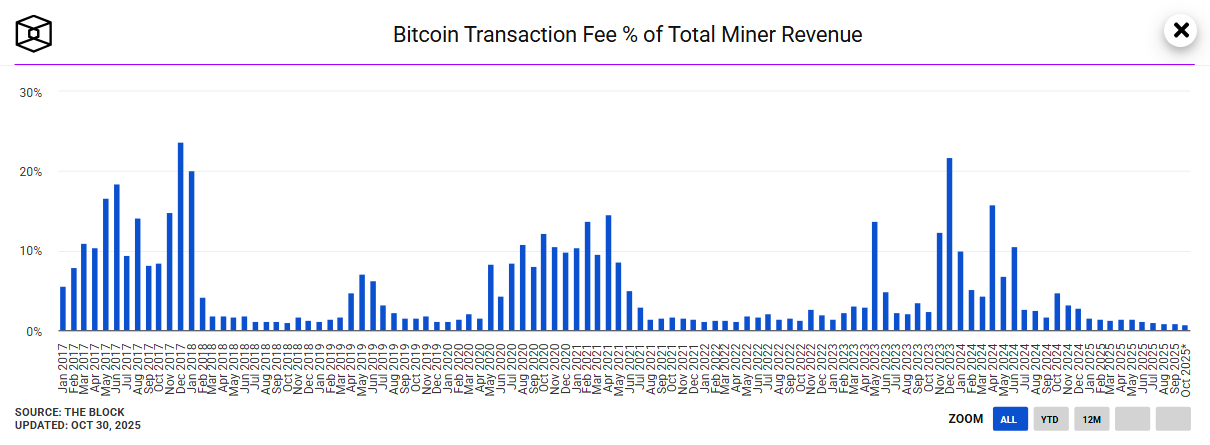
According to Theblock, the aggregate daily miner revenue in October 2025 is holding at $55–60 million with an average BTC price of $110 000. And for the first time in two years, an increase in profitability is observed even among small operators.
When Miners Capitulate, the Market Begins to Breathe
The Hash Ribbons indicator is one of the key tools for tracking network sentiment. It compares the 30- and 60-day moving averages of the hashrate. When the short line crosses the long one from above to below, capitulation begins: weak players turn off their equipment.
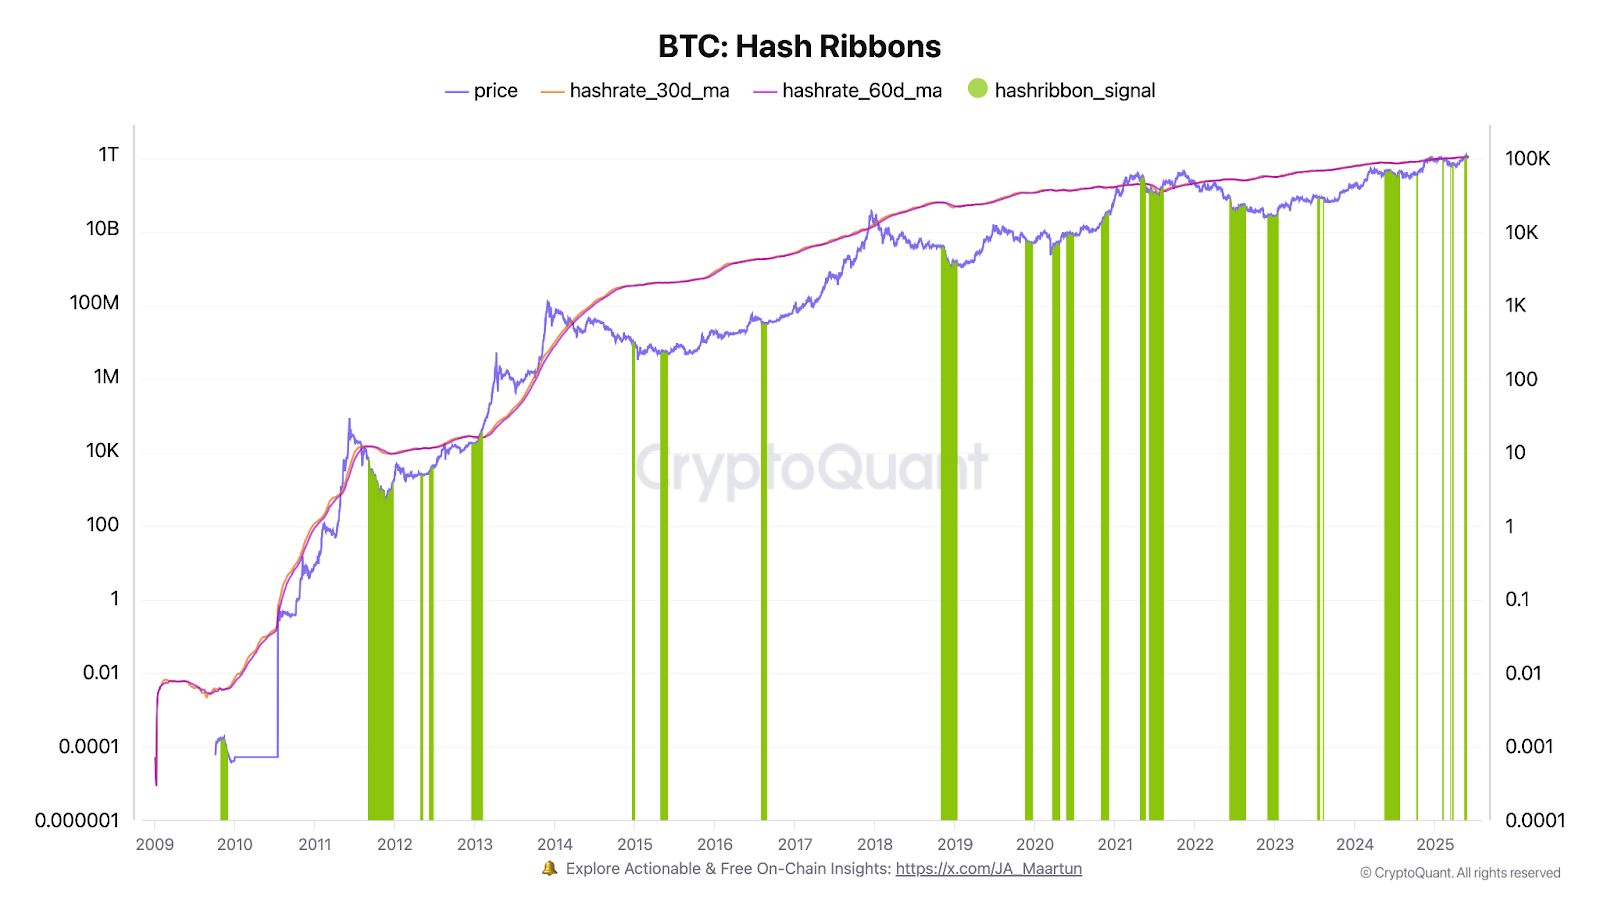
In previous cycles (2020, 2022, 2024), such crossovers coincided with price troughs. And in 2026, this indicator gave a "bullish" signal again in the summer, which coincided with Bitcoin's rise from $70 000 to $100 000. Another important parameter is the Miner's Position Index (MPI):
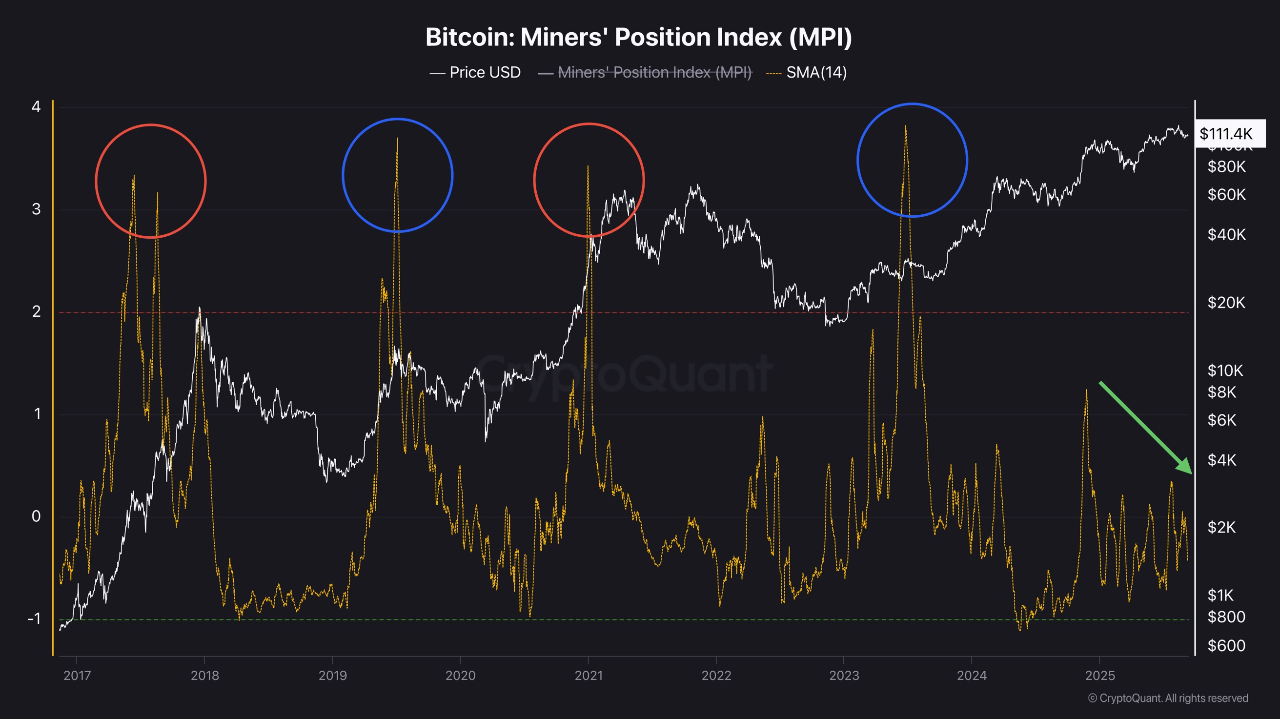
When it is above 2, miners are actively selling; below 0.5, they are accumulating. Currently, MPI is balancing around 0.8, which indicates a healthy but not speculative market.
Puell Multiple and Capitulation Cycles
The Puell Multiple indicator compares the current daily miner revenue with its 365-day MA. A value below 0.5 are historically the best entry points; above 4 indicates overheating.
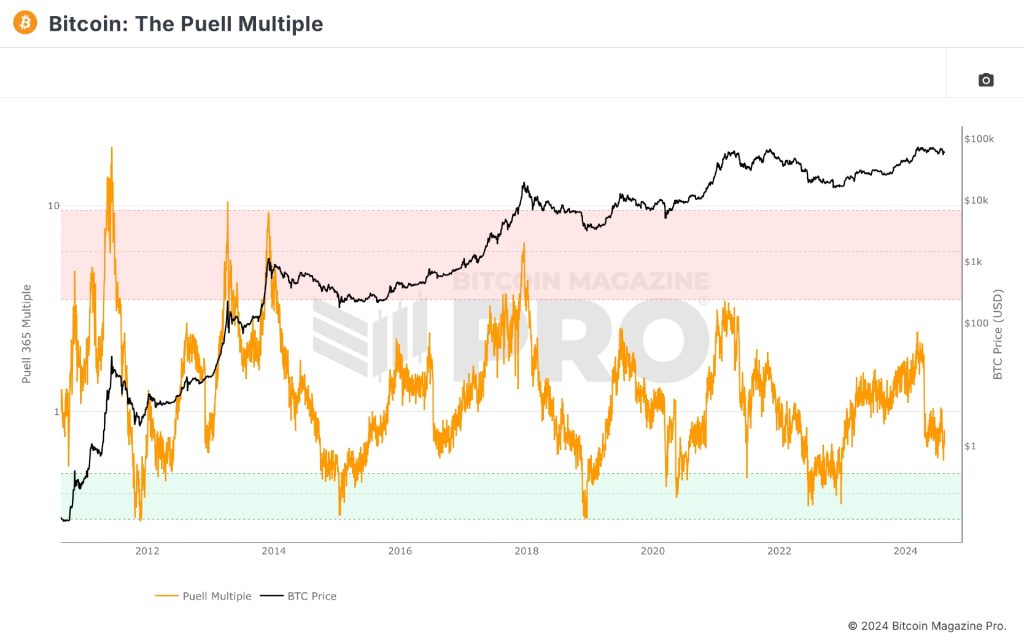
In the spring of 2024, Puell dropped to 0.48—this coincided with the lower boundary of the cycle. In October 2025, it is at the 1.3 level—a signal that the market has transitioned from the recovery phase to a phase of sustainable growth.
Energy and Ecology: A New Competitive Frontier
In 2026, the issue of energy consumption has become no less economic than political. The DAME Tax bill, proposing a 30% tax on electricity for miners, is being discussed in the US. In the EU, carbon footprint reporting is being implemented as part of ESG. According to the Bitcoin Mining Council, the share of renewable sources in mining has exceeded 50%, and the energy efficiency of new generation ASICs has grown to 15 J/TH. This makes large farms in Canada, Iceland, Kazakhstan, and Russia especially competitive.
Hash Price: A Real Indicator of Survival
Hash Price shows how many dollars a miner earns per 1 TH/s per day.
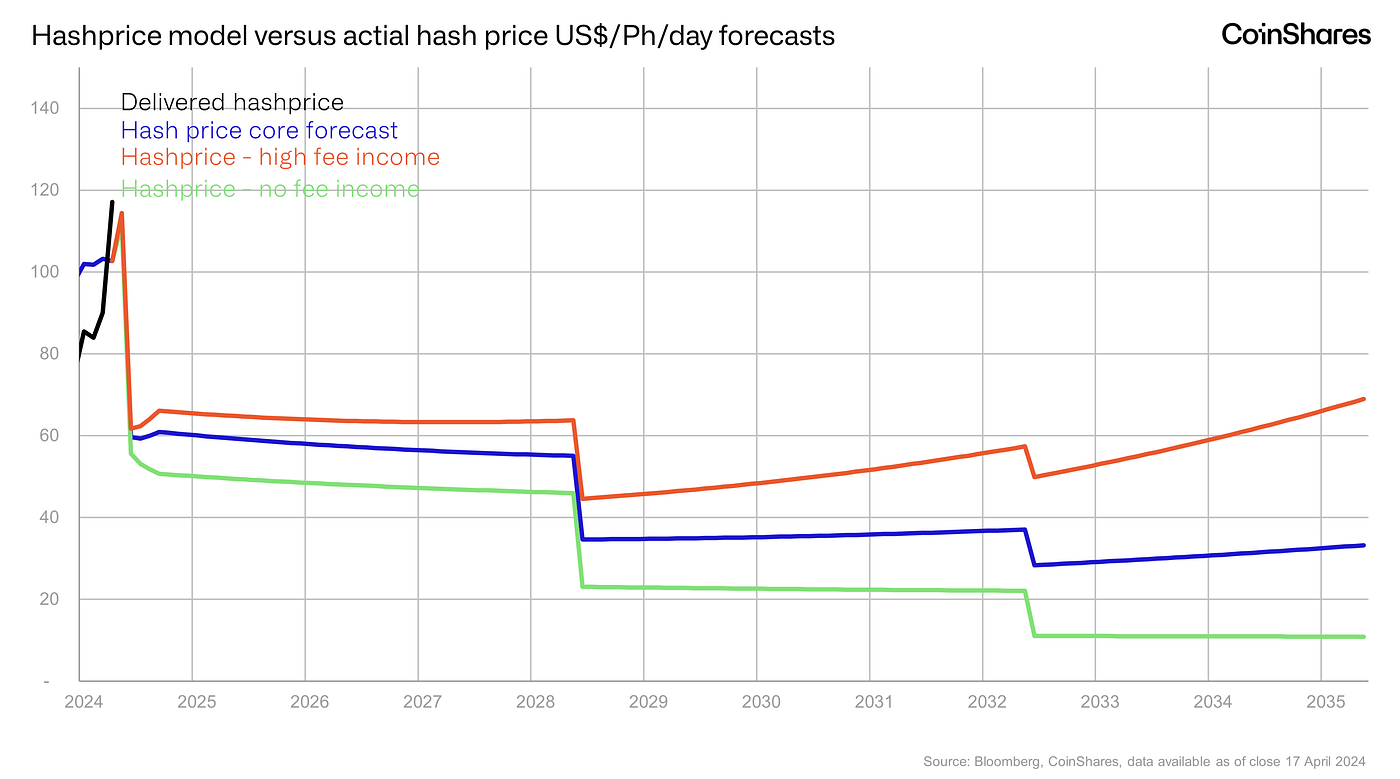
Currently, it is **$0.065–0.07 per TH/s/day**, which is higher than the post-halving minimum of 2024 ($0.045). At the same time, the lower profitability threshold remains around $0.04—below this, 60% of operators are working at a loss.
GPU Mining: New Life After Ethereum
After Ethereum's transition to Proof-of-Stake, GPU miners did not disappear—they switched to altcoins. In 2026, Kaspa (KAS) and Ergo (ERG) remain the most profitable: according to WhatToMine, the RTX 4090 brings $2.9–3.1 per day on Kaspa and $1.7 on Ergo. The growing interest in Proof-of-Work altcoins is associated with decentralization and a fairer distribution of tokens.
Macroeconomics and the Price of Electricity
The volatility of tariffs remains a serious factor. In the US and Europe, miners actively use "energy arbitrage": they turn on farms at night and on weekends when tariffs drop by 30–40%. Some operators even participate in Demand Response programs, receiving compensation for temporarily shutting down capacities.
Correlations and Forecast for 2026
According to JPMorgan Digital Markets, the 90-day correlation between hashrate and BTC price is 0.68, and between miner revenue and price—0.89. If the dynamics persist, by the end of 2025, the network could reach 1200–1300 EH/s, and Bitcoin—$130–150 thousand. Moreover, the market will remain "smart": the main share will be occupied by players using renewable energy and highly efficient ASICs.
Main Risks
- Regulatory pressure is intensifying: The EU is discussing limiting PoW mining within the framework of MiCA.
- Equipment obsolescence: Every 18–24 months requires constant investment, and the top 3 pools already control 55% of the hashrate.
- The discussion about quantum security is gaining momentum—it is possible that the first tests of quantum-resistant SHA-3 solutions will appear as early as 2028.
How to Use These Metrics in Practice
For an investor or analyst, key mining metrics are not "geek" indicators, but tools for forecasting future cycles.
- Hashrate and network difficulty are the barometer of trust in the ecosystem and a reflection of interest in the network. Their growth means increased security and capital involvement.
- Hash Ribbons and Puell Multiple help determine the phases of the cycle—from capitulation to recovery. These indicators historically precede the start of bull trends and point to market overheating.
- Hash Price and miner profitability are a test of the industry's viability. When Hash Price drops below $0.04 / TH/s / day, most miners go into the red; when it rises above $0.06, reinvestment and equipment upgrades begin.
- Energy indicators become a litmus test for "green" investments: the share of renewable energy in mining already exceeds 60%, and companies with clean sources gain advantages in attracting ESG capital.
Regular monitoring of this data through Glassnode, CoinMetrics, and LookIntoBitcoin allows one to see the market before it is reflected in the price. This is where mining transforms from a technical process into an analytical tool for forecasting future cycles of the crypto economy.
Conclusion: Mining as a Barometer of the Entire Market
Mining in 2025 has ceased to be just extraction—it has become the barometer of the blockchain economy. If 2021 was a race for hashrate, 2025 is a race for efficiency, clean energy, and the ability to read the numbers. The main lesson is simple: the market is cyclical, but the data is constant. Whoever can interpret mining metrics understands not only where Bitcoin is but also where the entire crypto world is heading.
And to not miss the foundation, start with the basics: subscribe to Crypto Academy and get access to the free course "Crypto from Zero to Advanced Investor" → https://academy.gomining.com/courses/bitcoin-and-mining
Telegram | Discord | Twitter (X) | Medium | Instagram