Индекс страха и жадности: как читать главный сигнал рынка
Перед тем как инвестировать, полезно понять, насколько текущее настроение рынка продиктовано паникой или, наоборот, чрезмерным оптимизмом.
Индекс страха и жадности (Fear and Greed Index) — это аналитический показатель, предназначенный для оценки двух ключевых эмоций, влияющих на поведение инвесторов. Именно страх и жадность формируют настроения на рынке и во многом определяют, насколько участники готовы переплачивать за активы.
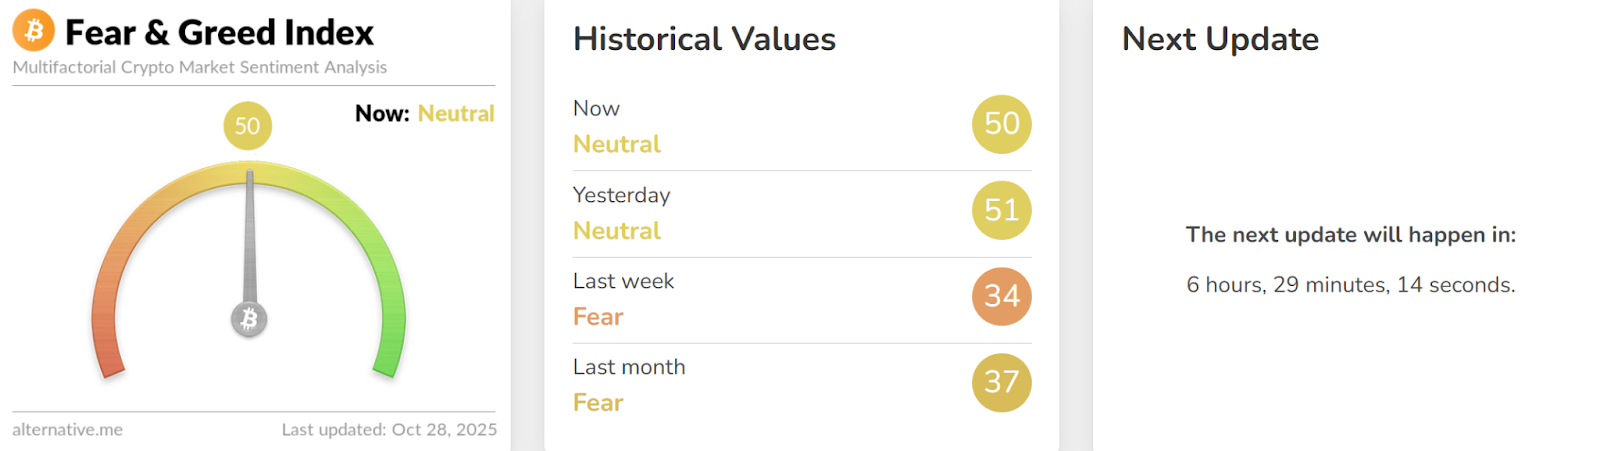
Источник: Alternative.me
Как применять Индекс страха и жадности и зачем он нужен?Когда на рынке преобладает страх, участники склонны массово продавать активы, часто избавляясь даже от перспективных монет по заниженной цене.
Период жадности, напротив, сопровождается необдуманными покупками и переоценёнными активами, инвесторы движимы желанием не упустить прибыль.
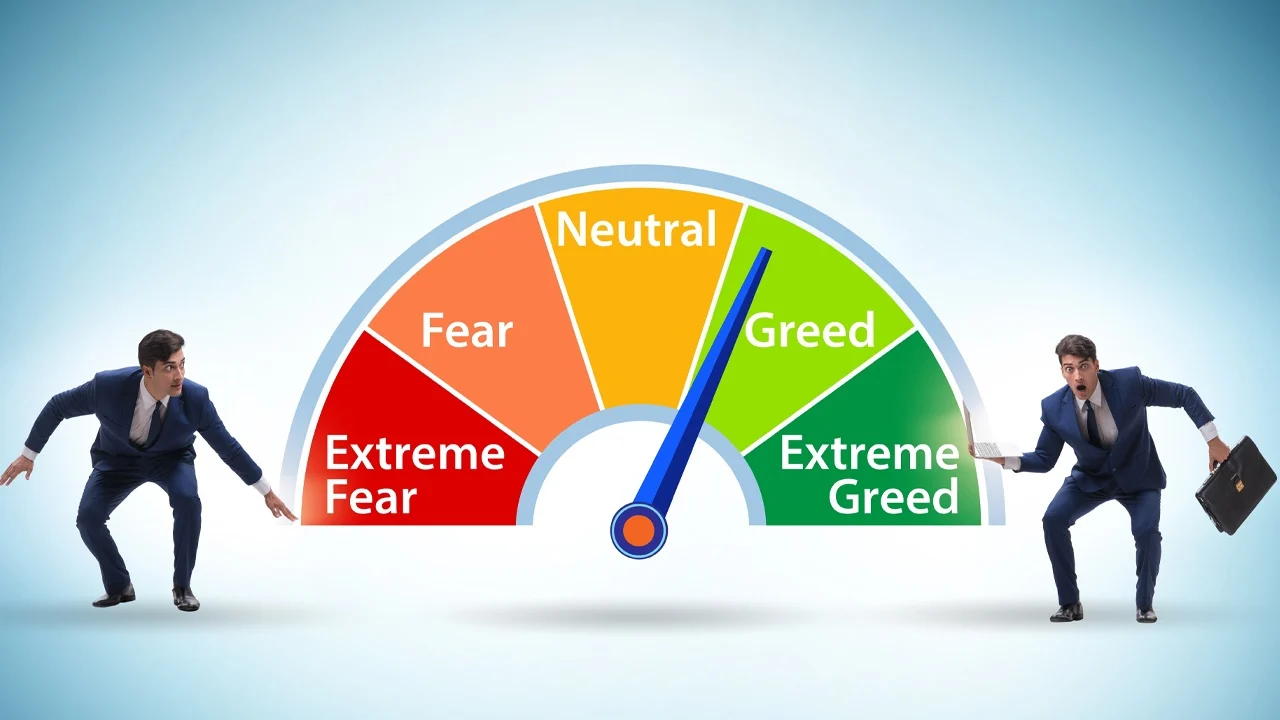
Создатели исследовали динамику настроений участников рынка и представили результаты в виде шкалы, значения которой варьируются от 0 до 100.
0– 25: Чрезвычайный страх
25 – 45: Страх
45 – 55: Нейтральное
55 – 75: Жадность
75 – 100: Чрезвычайная жадность
Важно учитывать, что для окончательной оценки точности данного индикатора всё ещё недостаточно статистических данных. Поэтому применять его стоит осмотрительно, как вспомогательный инструмент при формировании инвестиционной стратегии.
Какие факторы лежат в основе криптоиндекса страха и жадности?Индекс страха и жадности в криптовалюте формируется на основе множества показателей: колебаний цен, объемов торгов и рыночной динамики, активности пользователей в соцсетях, доли Bitcoin на рынке и популярности запросов в Google Trends.
Google Trends — это веб-инструмент от Google, позволяющий отслеживать, насколько часто пользователи ищут те или иные термины в определённые периоды и в разных регионах мира.На данный момент в состав индекса входят следующие показатели:
1. Волатильность (25%):Анализируется сопоставление текущих торговых объёмов и тенденций Bitcoin с их усредненными значениями за сопоставимые периоды.
2. Социальные сети (15%):Инструмент анализа Reddit пока находится в стадии разработки, тогда как мониторинг Twitter уже функционирует. Он отслеживает активность и интенсивность взаимодействий с Bitcoin-хештегами.
3. Опросы (15%):На данный момент эта функция приостановлена, однако ранее проводились еженедельные опросы участников крипто сообщества с целью измерения их рыночных настроений.
4. Доминирование (10%):Анализируется соотношение капитализации Bitcoin к общему объему рынка криптовалют. Колебания этой доли часто отражают смену настроений инвесторов от паники к излишней жадности и обратно.
5. Тренды (10%): Изучение статистики Google Trends по Bitcoin-запросам. Резкие увеличения популярности отдельных поисковых запросов могут сигнализировать о панике на рынке или повышенном интересе инвесторов.
Далее каждое значение умножается на свой вес в расчёте индекса:
1. Волатильность: 20 × 0,25 = 5
2. Рыночный импульс/объём торгов: 75 × 0,25 = 18,75
3. Активность в социальных сетях: 70 × 0,15 = 10,5
4. Доля Bitcoin на рынке (доминирование): 30 × 0,10 = 3
5. Популярность запросов в Google Trends: 25 × 0,10 = 2,5Суммирование этих взвешенных показателей дает итоговое значение индекса за день:
Индекс = 5 + 18,75 + 10,5 + 3 + 2,5 = 39,75
Исходя из полученного числа, рыночное настроение классифицируется как «Страх». Согласно логике индекса, это может указывать на благоприятный момент для покупки активов.
Источник: Bitstat.top
Динамика индекса настроений на крипторынке:
На этом графике показано, как со временем изменяется показатель «страха и жадности» в индустрии криптовалют.
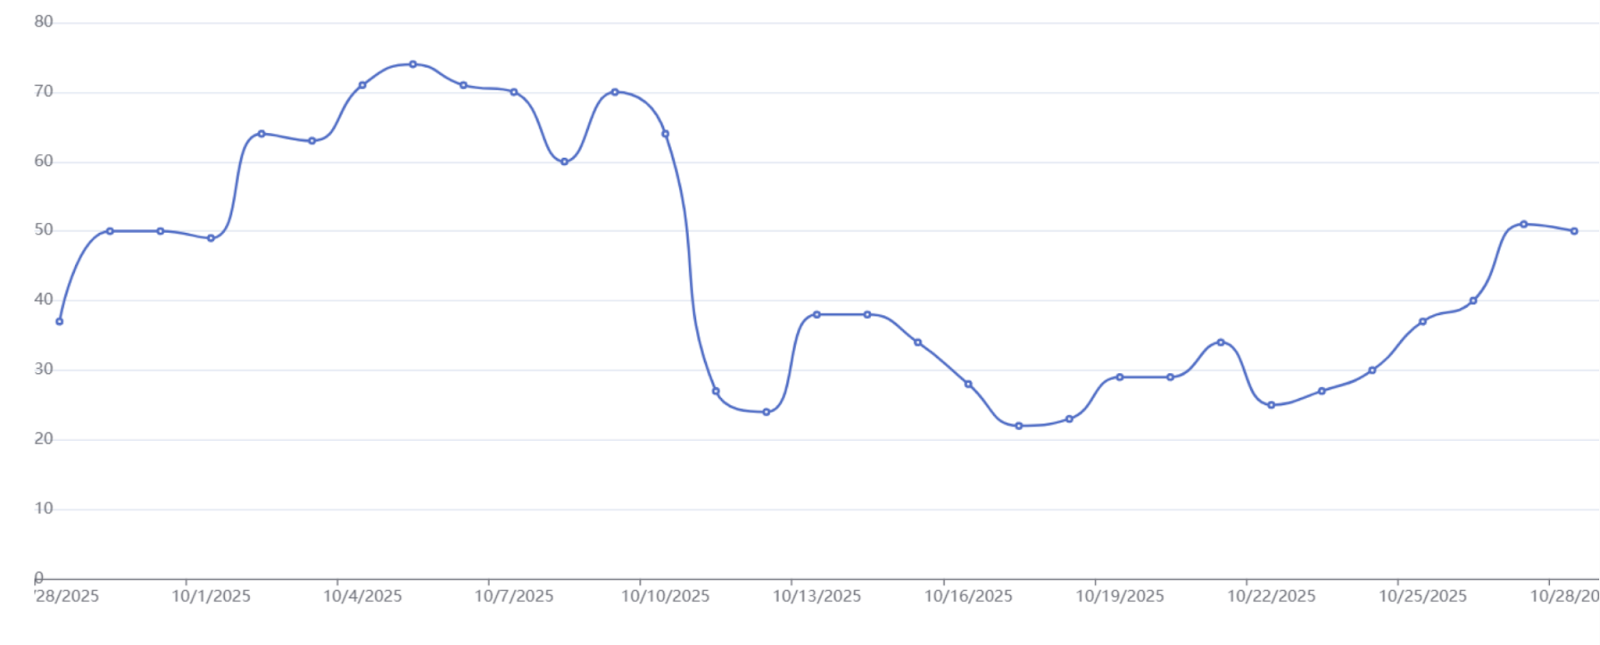
Источник: Bitstat.top
Когда стоит применять индекс страха и жадности?Принцип работы индекса отражает знаменитое высказывание Уоррена Баффетта: «Покупай, когда другие боятся, и продавай, когда другие жадничают». Уоррен Баффетт — американский инвестор, миллиардер и председатель совета директоров компании Berkshire Hathaway.
Этот показатель позволяет понять эмоциональное состояние участников крипторынка — от паники до чрезмерного оптимизма, что помогает оценить ситуацию не только по биткоину, но и по большинству других цифровых активов.
Наибольшую ценность индекс представляет при анализе долгосрочных тенденций, а не при краткосрочной спекулятивной торговле.
Тем не менее, значения «крайний страх» и «чрезмерная жадность» могут быть полезны при использовании стратегии усреднения стоимости (DCA), когда инвестор постепенно приобретает активы в моменты падения рынка и фиксирует прибыль при пиковых значениях показателя.
DCA (Dollar-Cost Averaging, усреднение стоимости) — это метод инвестирования, при котором вложения в активы, такие как акции или криптовалюта, производятся регулярно на фиксированную сумму, независимо от колебаний их рыночной цены.
Подписывайся и получи доступ к пока еще бесплатному курсу по крипте с 0 до продвинутого инвестора.Telegram | Discord | Twitter (X) | Medium | Instagram NFA, DYOR.
Рынок криптовалют работает круглосуточно и без перерывов. Перед инвестированием всегда проводите собственное исследование и оценивайте риски. Ничто из вышеупомянутого в этой статье не является финансовым советом или инвестиционной рекомендацией. Контент предоставляется «как есть», все заявления проверяются третьими сторонами и соответствующими внутренними и внешними экспертами. Использование этого контента для целей обучения искусственного интеллекта строго запрещено.
December 4, 2025