

Earlier in this series we set out a framework for reading Bitcoin cycle tops: no single chart calls a peak, but when on chain valuation, trend models, flow data and sentiment begin to flash simultaneously, the probability of exhaustion rises materially. That piece was written into a market trading near $126,000. This is the same framework, read from the other end.
Bottoms are harder to read than tops, and the difficulty is behavioural rather than analytical. At a top, the indicators argue against a tape that is rewarding you. At a bottom, they argue against a tape that is punishing you, and each further week of drawdown makes the data look less like an opportunity and more like a broken thesis. Tops are events; bottoms are processes.
This article sets out what the framework currently reads, what it does not tell us, and what would falsify it. It reaches no conclusion as to whether a bottom has formed, because the data does not presently support one.
Important note. This document is general market commentary for eligible institutional and professional recipients. It is not investment research, investment advice or a recommendation, and it is not an offer of any security or fund interest. GoMining operates Bitcoin mining infrastructure and manages vehicles holding mining assets, and therefore has a direct commercial interest in the subject matter; readers should not assume this analysis is disinterested. None of the indicators below identify a cycle bottom with certainty, and historical relationships described here are past observations that are not a reliable indicator of future results. Market data is as at 5 August 2026. The Important Disclosures at the end form part of this document and should be read in full.
Where the Market Stands
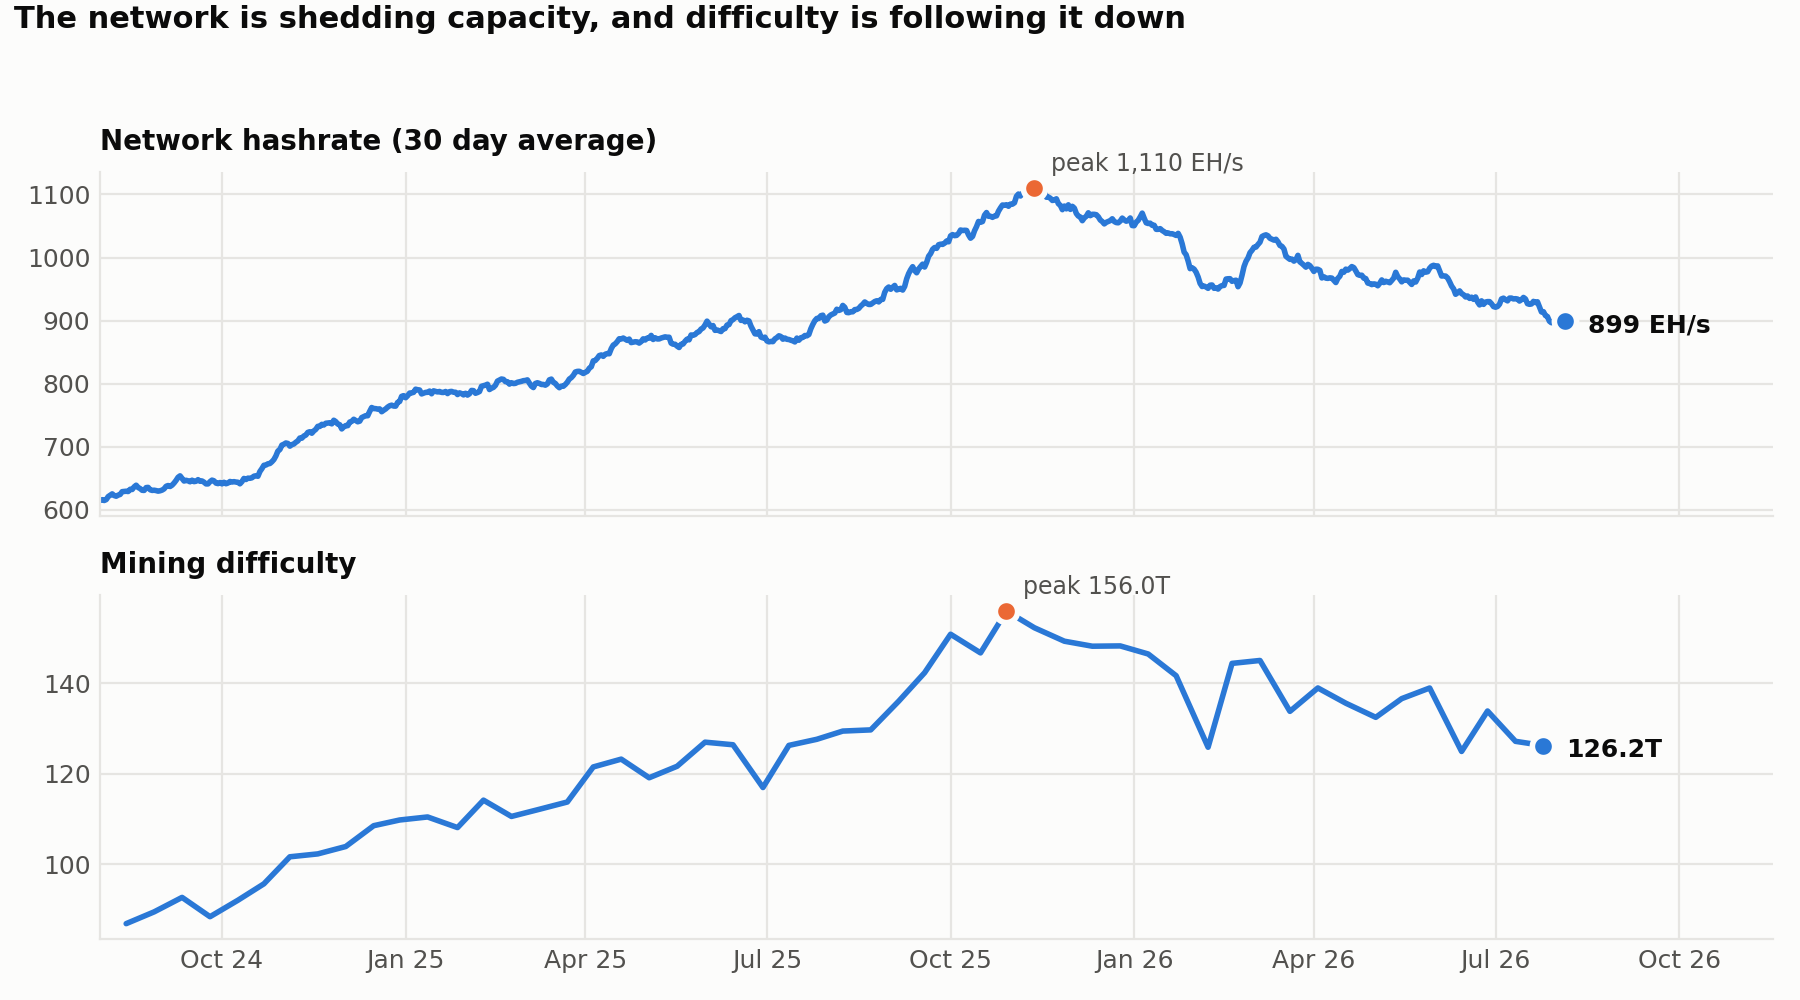
Bitcoin trades between $63,000 and $64,000, roughly 27% lower year to date and approximately 50% below the October 2025 peak. The network is producing around 900 EH/s on a 30 day basis, against a November 2025 peak near 1,110 EH/s, a contraction of about 19%. Mining difficulty has fallen 19.1% over the same span, from an all time high of 155.97 trillion set at the end of October 2025 to 126.23 trillion.
Every one of those figures reads as a negative headline. Several are also, historically, bottom side readings. Exhibit 1 sets out the scorecard; separating the two categories is what a multifactor framework is for.
Exhibit 1: Bitcoin cycle bottom scorecard, 5 August 2026. See data sources and important disclosures at the end of this article.
On Chain Valuation: Price Against Cost Basis
As at 4 August the MVRV Z Score reads 0.37, with an MVRV ratio of 1.23 against a realized price of $52,337, the market valuing Bitcoin roughly 23% above what the network collectively paid for it, against readings of four and above at the 2017 and 2021 peaks. NUPL stands at 0.18, well below the 0.75 conventionally associated with euphoria. Neither is the deeply negative territory that marked the 2018 and 2022 lows, but both sit firmly in the lower band of their distributions.
The more instructive signal sits beneath the aggregate. Short term holders carry an MVRV of 0.95 and are collectively underwater, while long term holders remain at 1.30 and in profit. That spread identifies the marginal seller as a recent, low conviction entrant, and such supply exhausts itself in a way that long term holder distribution at a cycle top does not.
Trend Models: The Four Year Mean
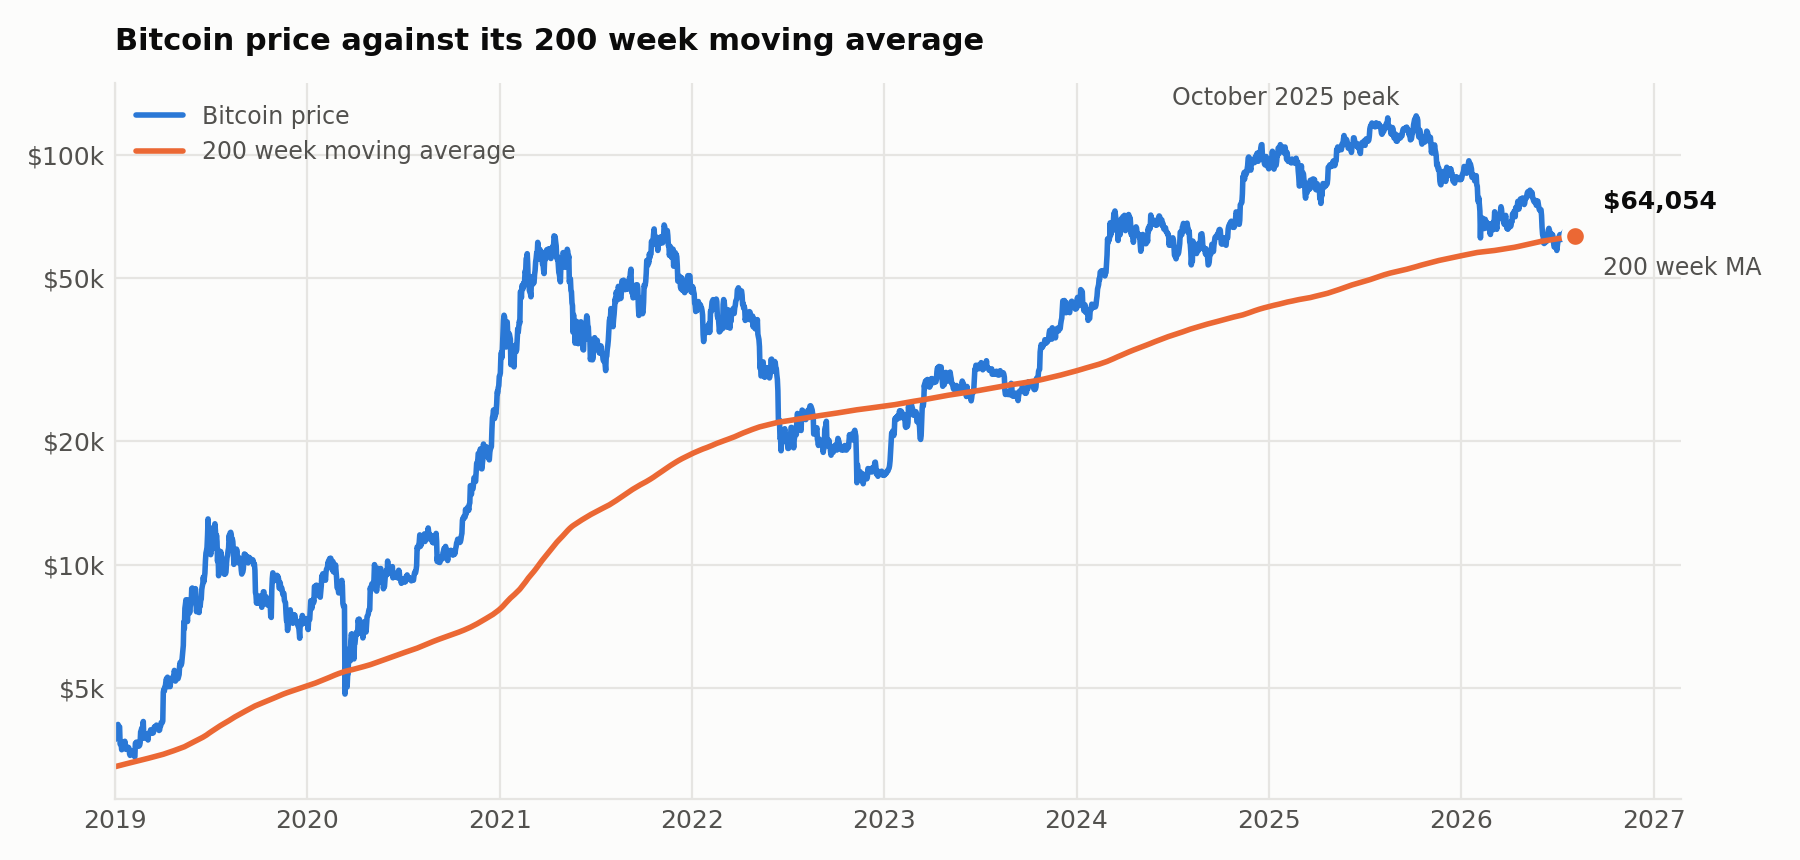
Bitcoin’s 200 week moving average, effectively its average closing price over four years, sits at $63,770, and price is trading either side of it. Bitcoin has historically spent approximately 92% of its history above this level. Prior bear markets have tended to lose downward momentum on reaching it, though the pattern is less clean than that phrasing suggests: in 2022 price traded around and below the average for several months rather than rebounding from it. Strategy, the largest corporate holder of Bitcoin, began publicly tracking the level in early August 2026.
That observation carries a limitation. As Exhibit 2 shows, the level has only been genuinely tested three times: March 2020, through most of 2022, and now. Three episodes are not a distribution, and this is the first to occur in a market with spot ETFs, corporate treasury programmes and a competing institutional bid for mining energy. We treat it as a reference point for where price sits against accumulated cost, not as a mechanism that produces an outcome.
The shorter horizon is weaker: the 200 day EMA sits near $73,000, leaving price some 13% below it with daily structure still trending lower. That is not a contradiction. The 200 week average is a valuation marker, the 200 day a trend marker, and at bottoms they routinely disagree because an asset can be historically cheap and still falling.
The Miner Layer: Bitcoin’s Cost Floor
Mining is the one input in Bitcoin with a measurable marginal cost of production, which makes it the most informative part of the framework.
Production cost and miner stress
JPMorgan estimates an all in production cost of approximately $78,000 per Bitcoin. As at its June note, price had traded around 19% below that level for five consecutive months with roughly 20% of the global fleet running at a loss; at prices since, that run extends to around seven months. Public miners sold more than 32,000 BTC in the first quarter, exceeding their disposals for all of 2025. The Puell Multiple sits below its long run mean of 1.0, and the Miner Cycle Stress Composite, which combines it with an inverted miner capitulation index, fell to new 2026 lows in early July, at levels comparable to prior cycle bottoms.
Why we are not leaning on Hash Ribbons
The Hash Ribbon indicator recorded a three month capitulation from late November 2025 into February 2026, one of the longest on record. Roughly twenty such capitulations have occurred since 2011 and the majority coincided with local or major price bottoms, including January 2015, December 2018 and December 2022. We would nonetheless caution against relying on that record this cycle, for two reasons.
First, the February signal has not been followed by a price recovery: six months on, Bitcoin is 27% lower year to date. Second, and more fundamentally, Hash Ribbons measures hashrate withdrawal and infers distress from it. That inference was sound when the only reason to unplug a machine was insolvency. It is considerably weaker when a material share of withdrawn capacity is being redeployed to a better paying workload. An indicator whose causal mechanism has changed should not be credited with its historical hit rate.
The difficulty reset is uneven, not linear
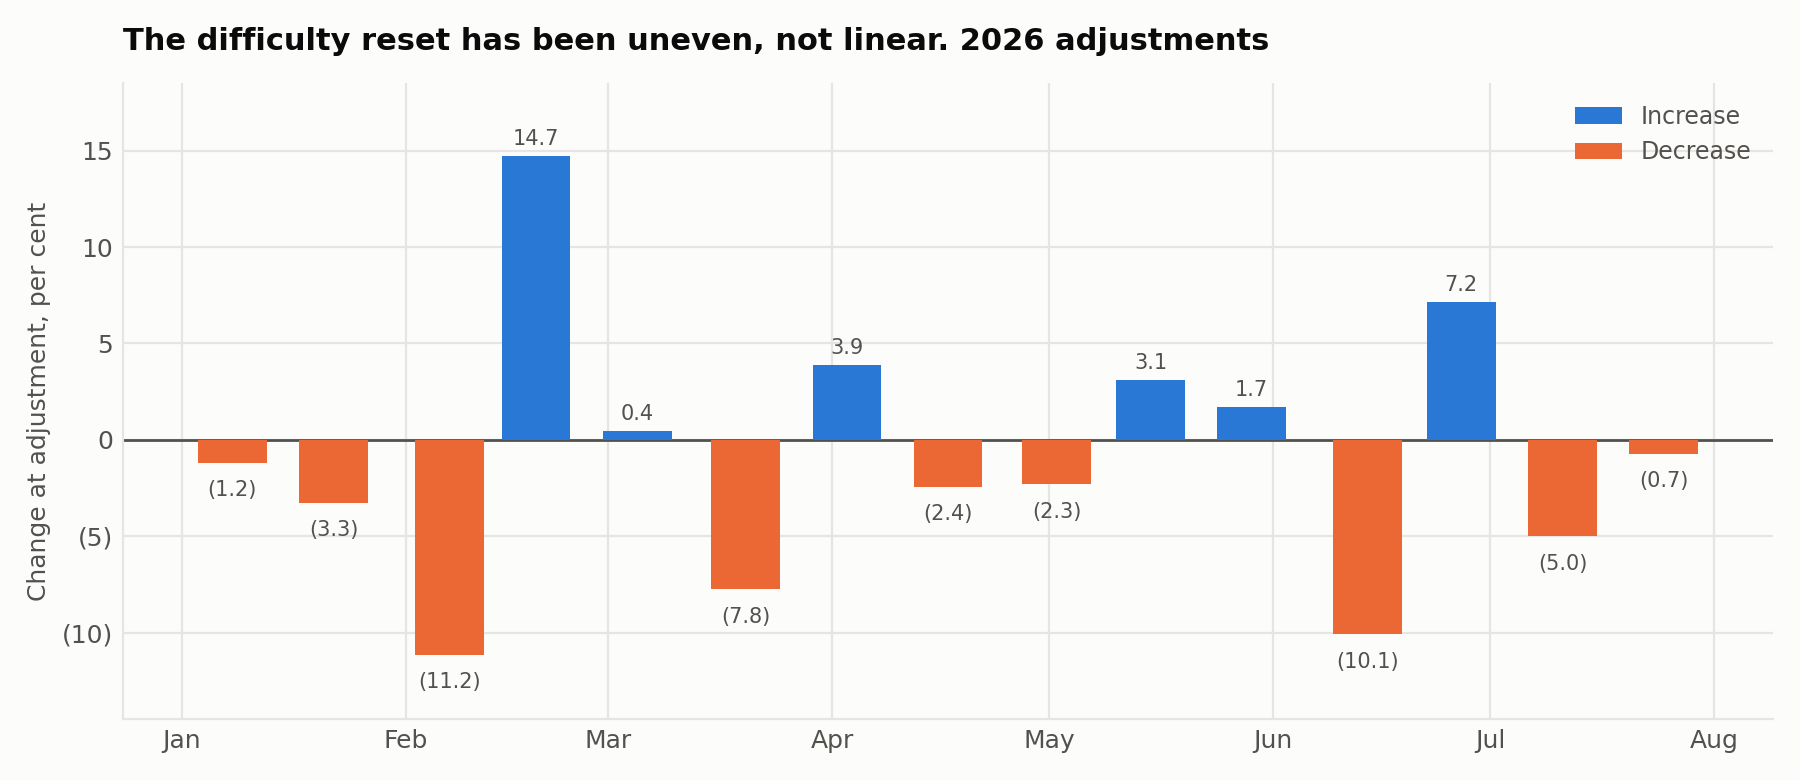
A 10.09% drop on 14 June was partly offset by a 7.15% rise later that month, leaving June down roughly 3.6% net, followed by about 5.7% net across July; February saw an 11.2% fall and a 14.7% rise within three weeks. This is the self correcting mechanism working as designed, price below production cost powers down high cost capacity, difficulty resets, and per unit economics improve for what remains, but it corrects in both directions, and the 8 August estimate is positive. A single negative adjustment is not evidence of a floor.
Dollar revenue and bitcoin revenue
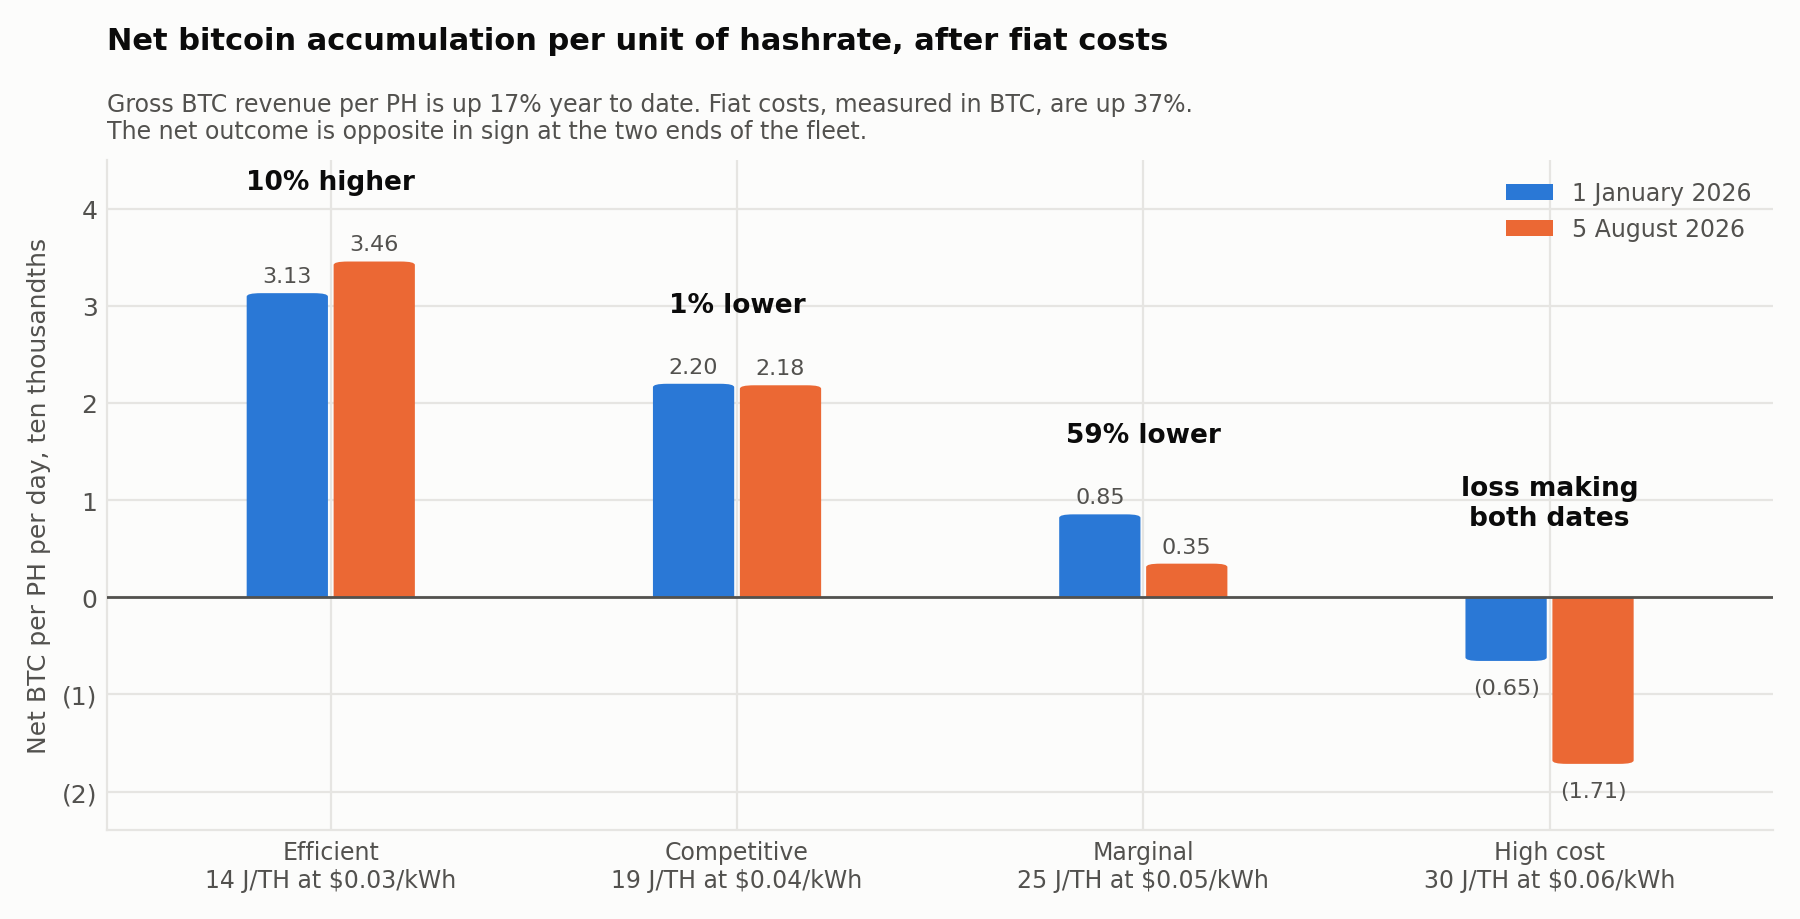
USD hashprice sits at $32.10 per PH per day, recovering from a late June low near $28, with the forward market pricing $30.83 over the next six months. Denominated in Bitcoin, hashprice is roughly 0.000503 BTC per PH per day, approximately 17% higher than on 1 January. That figure is widely quoted as evidence that miners are unharmed in Bitcoin terms. It requires two qualifications, and after both it does not support that conclusion.
First, it is arithmetic rather than insight. Bitcoin denominated hashprice is a function of difficulty, block subsidy and fee share alone; the dollar price does not enter the calculation. The 17% rise is simply the inverse of the year’s decline in difficulty, restated, and it self liquidates, since every positive difficulty adjustment reduces it one for one. The case for difficulty stabilising and the case for rising Bitcoin denominated hashprice are mutually exclusive.
Second, and more materially, it is a gross figure. Power, hosting and maintenance are contracted in fiat, and with Bitcoin 27% lower year to date an unchanged dollar cost is approximately 37% higher measured in Bitcoin. Gross Bitcoin revenue per unit of hashrate is up 17%; the Bitcoin cost of producing it is up 37%. Whether net accumulation has risen or fallen depends entirely on where an operator’s costs sit.
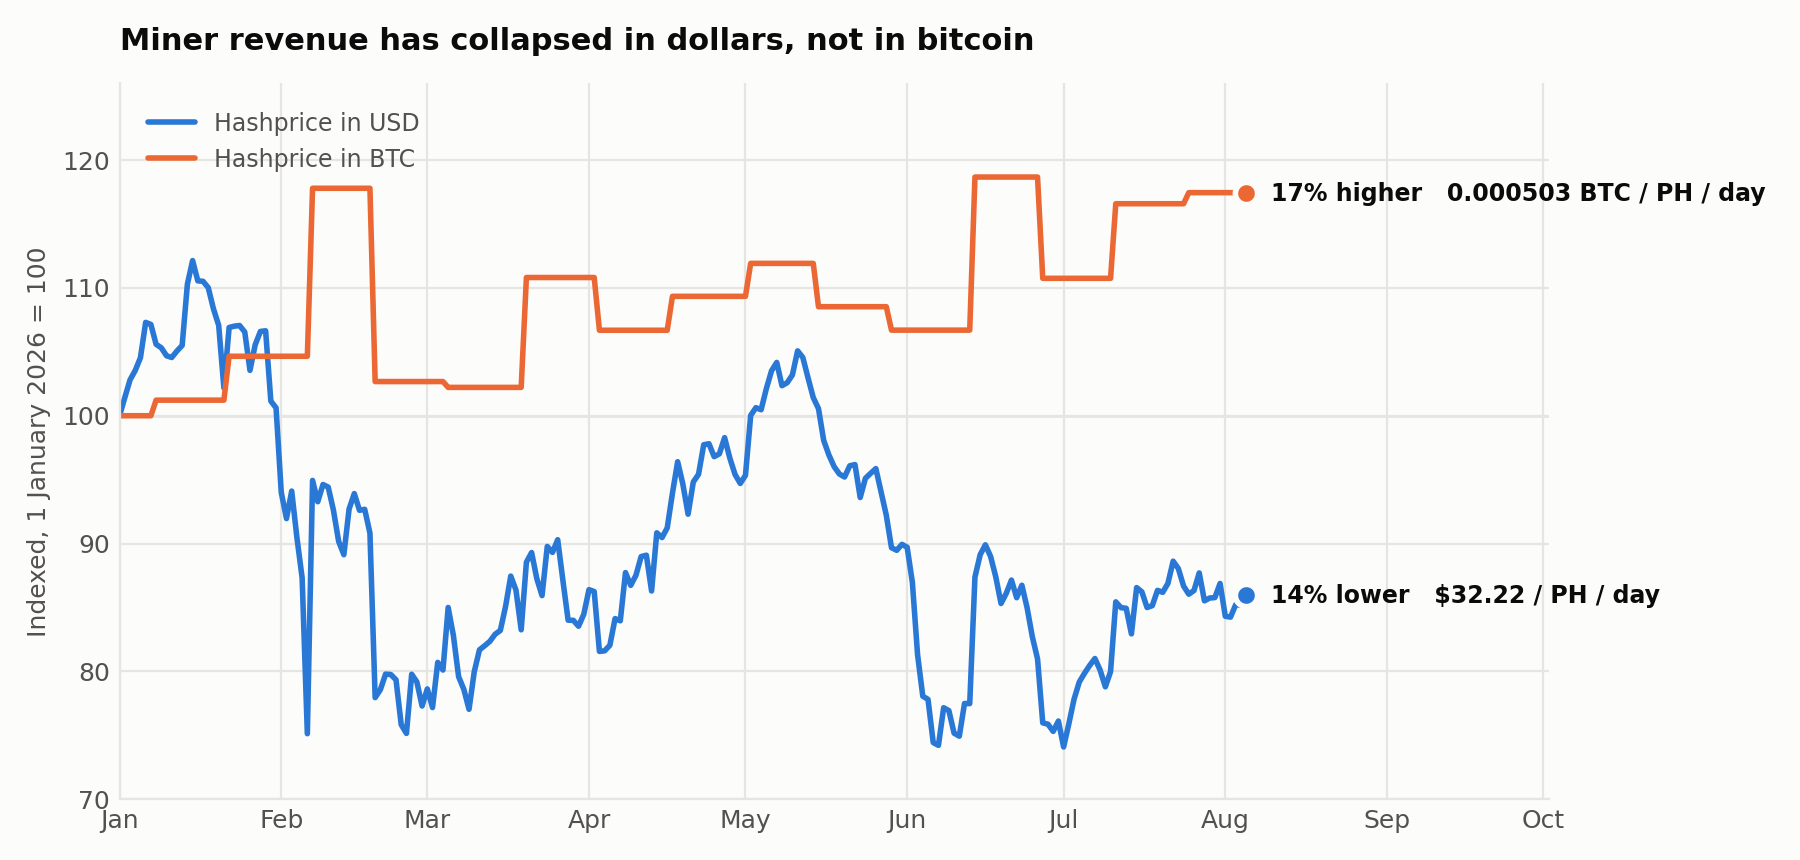
Exhibit 6 works this through for four illustrative fleet archetypes. On these assumptions, net Bitcoin accumulation per unit of hashrate is up approximately 10% year to date for a fleet at 14 J/TH on $0.03 power, roughly flat at 19 J/TH on $0.04, down about 59% at 25 J/TH on $0.05, and negative on both dates for capacity at 30 J/TH on $0.06. The energy hashprice implied by those four fleets, approximately $96, $71, $54 and $45 per MWh, brackets the reported market range of $109 down to $41, which is a reasonable indication that the cost model is calibrated.
The conclusion is narrower than the headline number, and it is the one that matters. The proposition that a drawdown improves Bitcoin denominated accumulation holds only at the efficient end of the fleet. Across the marginal portion of the network it is false, and for the highest cost capacity the position is net Bitcoin depletion. This is the same finding the difficulty data produces, reached independently: the network is not uniformly distressed, it is separating.
Capacity is also leaving voluntarily
Public miners have announced more than $70 billion in cumulative AI and HPC contracts, with expectations that AI could represent around 70% of sector revenue by year end, up from roughly 30% earlier in 2026. The United States shed approximately 30 EH/s, an 8% decline to 36.7% of global hashrate, and Kazakhstan has left the top ten for the first time. Insolvency and voluntary reallocation produce an identical chart, but only one is a distress signal.
Hashrate Versus Spot: The Objection That Comes First
Any allocator considering mining exposure should confront the simplest objection first. If the all in cost of producing a Bitcoin is approximately $78,000 and spot is $63,000, producing Bitcoin currently costs more than buying it. On a static, single period basis spot is the better instrument, and no framing changes that. The arguments for hashrate are conditional, and are more honestly stated as conditions than conclusions:
- They require the operator to sit below the network’s marginal cost rather than at it. Exhibit 6 shows the outcome is opposite in sign at the two ends of the fleet, so this is not a detail.
- They require a view that hashprice recovers. Hashrate is a levered and decaying claim on hashprice; spot is an undated one for one claim on price. Leverage helps if hashprice recovers and compounds the damage if it does not.
- They require the difficulty reset to persist. If capacity returns, or if AI driven reallocation reverses, the per unit improvement that makes surviving capacity attractive is competed away.
Against those conditions, hashrate carries a cost spot does not: it decays. Hardware depreciates, difficulty trends upward across cycles, and a unit of hashrate is a wasting asset in a way a Bitcoin is not. Whether the trade is worth making depends on an allocator’s time horizon, cost of capital and view on hashprice recovery, not principally on where the cycle sits, which is the framing most commentary, including some of our own, has tended to adopt.
Flows: Marginal Demand Versus Structural Demand
Spot Bitcoin ETF net flows turned negative year to date for the first time since the January 2024 launch, with roughly $5.4 billion of net outflows in the first half of 2026. A thirteen day streak from 15 May to 3 June, the longest on record, accounts for approximately $4.4 billion of that. Aggregate assets across the complex have fallen from a record $169.5 billion in October 2025 to approximately $78 billion, although most of that decline reflects the fall in price rather than redemptions. Hashdex’s DEFI will become the first U.S. spot Bitcoin ETF to close, on 17 August 2026.
Set against that, long term holder supply reached an all time high of 16.64 million BTC on 21 July, approximately 83% of circulating supply, accumulating at roughly 200,000 BTC per month after breaking a two and a half year downtrend in May. Comparable patterns appeared in the 2015 and 2019 bear markets. The divergence is the signal: marginal demand has turned negative while structural holding sets records, tightening the liquid float into falling prices. That is a condition rather than a catalyst, and it is reversible, a cohort holding 83% of supply can become a source of supply as readily as it became a sink.
Sentiment
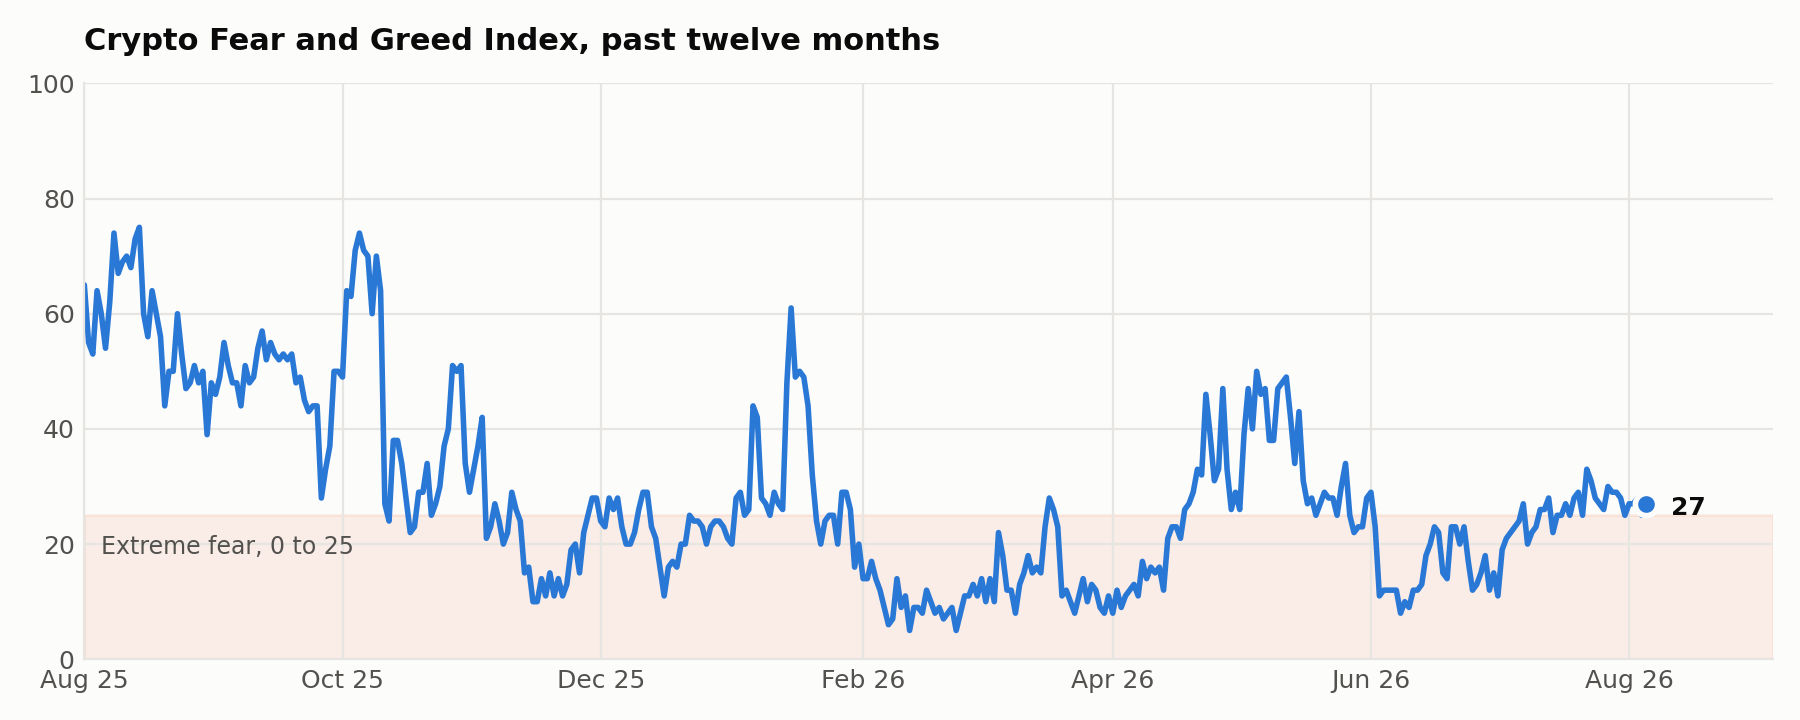
The Fear and Greed Index has spent most of 2026 in or around extreme fear territory and remains close to that band, reading in the high 20s at the time of writing; indices built on different methodologies read somewhat higher. Sustained readings here correspond to overly pessimistic positioning rather than to deteriorating fundamentals, but duration matters as much as level: an index depressed for seven months describes an established regime rather than a moment of panic, and it is panic rather than resignation that has marked the sharper lows.
The defining sentiment variable this cycle is opportunity cost rather than fear. BlackRock’s AI and technology ETF gained 39% through July while the crypto market fell approximately 36%. As K33 Research observed, much of the market views the opportunity cost of holding Bitcoin as too high while anything AI related appreciates. Bottoms rarely form because investors conclude an asset is bad; they form because a better alternative exists, and this one is bidding for the same energy that secures the network.
What Convergence Would Look Like
Rather than forecast a date, the more useful exercise is to define what agreement across the framework would require. The following are observations we would want to see, not a trading framework:
- Difficulty stabilising, then printing consecutive positive adjustments rather than alternating ones.
- Hashprice sustained above roughly $35 per PH per day, meaningfully above the forward market’s $30.83, and above the level at which the marginal fleet breaks even.
- A monthly close back above the 200 week moving average, followed in time by a reclaim of the 200 day.
- Spot ETF flows positive across a full month, not a single week.
- MVRV Z Score above 1.0 while long term holder supply continues to rise.
- Fear and Greed sustained out of extreme fear, alongside a broader return of risk appetite to the sector.
No single item is sufficient, and three or four occurring together would still be a probabilistic statement rather than a conclusion.
What Would Falsify This Reading
A framework that cannot be wrong is not analysis. The following would each, independently, undermine the reading above:
- A structural repricing of energy. If AI and HPC demand permanently raises the opportunity cost of a megawatt, hashprice may not mean revert at all. The forward market at $30.83 is not pricing a recovery, and forward curves have been better guides than cycle analogues in energy linked markets.
- Obsolescence of the four year cycle. Every metric here is calibrated on the 2011 to 2022 cycles, in a market without spot ETFs, corporate treasury programmes or a $70 billion institutional bid for mining infrastructure. The burden of proof sits with those asserting the analogues still transfer.
- Difficulty resuming growth without a price recovery, which would compress hashprice further from an already depressed base and invalidate the self correction argument.
- Long term holders distributing. The 83% figure is presented as conviction; it is equally consistent with illiquid supply not yet tested by a lower price.
- A sustained break below the 200 week average. The 2022 precedent, months of trading around and beneath it, is the more likely template than the sharp 2020 rebound.
Final Thoughts
The framework does not change at the bottom of a cycle; only the direction of the reading does. Several components sit where they have historically sat near bottoms: price at its four year mean, valuation metrics in the lower band, persistent extreme fear, record long term holder supply, and a network shedding its highest cost capacity. Several do not: the trend remains down, marginal demand is negative, the forward hashprice market prices no recovery, and the indicator with the strongest historical bottom record has already fired and, so far, failed.
That is a mixed reading, and we would rather report it as mixed than resolve it. Frameworks like this narrow a range of outcomes; they become dangerous when used to manufacture a conclusion the data does not carry.
For allocators, the more durable observation has nothing to do with timing. It is that the dispersion within Bitcoin mining is now wider than the dispersion between Bitcoin mining and Bitcoin itself. A fleet at 14 J/TH on cheap power and a fleet at 30 J/TH on expensive power face identical prices, identical difficulty and identical protocol rules, and are currently moving in opposite directions measured in Bitcoin. Where the cycle sits is the same question for both. It is not the question that determines the answer.
Important Disclosures
- Conflicts of interest. GoMining operates Bitcoin mining infrastructure, sells and services mining capacity, and manages pooled vehicles holding Bitcoin mining assets. GoMining and its affiliates therefore have a direct commercial interest in the subject matter of this article, may hold or transact in the assets discussed, and may hold views or positions inconsistent with those expressed here. Readers should not assume this analysis is disinterested. No contributor’s compensation was tied to the views expressed, though contributors and employees may hold or trade digital assets subject to internal compliance policies. 2. Not advice, and not an offer. This is general market commentary intended solely for eligible institutional and professional recipients (e.g., Qualified Institutional Buyers, Accredited Investors, or Professional Clients under applicable local financial laws). It is not independent investment research, is not investment, legal, or tax advice, and is not a recommendation. It is not an offer to sell or a solicitation of an offer to buy any security, fund interest, or digital asset. Any offering is made solely under the relevant vehicle’s confidential offering documents, which contain the material terms and risk factors and prevail over anything stated here. If you are a retail investor, you should not read or rely on this document. 3. Past performance and forward-looking statements. Historical relationships between indicators and subsequent outcomes are past observations, are not reliable indicators of future results, and may not recur — this article sets out several reasons why they may not. Statements about difficulty, hashprice, and market conditions are forward-looking and rest on assumptions that may prove incorrect. Nothing here is a forecast, projection, target, or guarantee. 4. Derived figures and illustrative assumptions. The hashprice and net-yield series are calculated by GoMining Institutional from network difficulty, block subsidy, and price using the assumptions stated in the exhibit notes; small changes to those assumptions change the results. The fleet efficiency and power-price inputs in Exhibit 6 are illustrative, chosen to span the observable market range for conceptual analysis only, exclude depreciation, financing, overhead, and taxation, and are not representative of the actual costs, margins, or economics of GoMining or of any GoMining-managed vehicle. 5. Risk. Bitcoin is volatile and speculative, and an investor may lose the entire amount invested. Mining assets carry additional risks, including rising network difficulty, falling hashprice, hardware obsolescence, energy price and hosting counterparty risk, future reductions in the block subsidy, regulatory change, custody risk, and limited liquidity. Interests in private vehicles are typically illiquid and bear fees that reduce returns. Digital assets and vehicles holding them are generally not protected by statutory investor compensation schemes. 6. Scope, sources, warranty, and liability. Figures are as at the dates stated and are subject to change; GoMining has no obligation to update them. Third-party data is attributed where used and has not been independently verified or audited. All information is provided "as is" without warranty of any kind, express or implied. To the maximum extent permitted by law, GoMining, its affiliates, directors, officers, and employees disclaim all liability for any direct or indirect loss or damage arising from reliance on this content. This article is not directed at any person in a jurisdiction where its distribution would be unlawful or would require registration, and may not be redistributed without prior written consent.
Data sources: charts built from primary data, blockchain.com (price history, 200 week moving average), mempool.space (network hashrate, difficulty and per epoch adjustments), alternative.me (Fear and Greed Index). Hashprice and net yield series derived from difficulty, block subsidy and price, cross checked against Hashrate Index to within 0.2%. Reported figures: Hashrate Index (hashprice, energy hashprice); AhaSignals and CryptoQuant (MVRV, NUPL, holder cohorts, Puell Multiple, Miner Cycle Stress Composite); CoinDesk and The Block (JPMorgan production cost estimate, 200 week moving average, ETF closure, Hash Ribbons); Blockspace (regional hashrate, AI and HPC reallocation). Market data as at 5 August 2026.
GoMining Institutional