
If we put it very simply, chain GDP is an attempt to measure how much real economic value a blockchain produces, rather than how much its token happens to cost on an exchange.
In traditional economics, GDP reflects the total value that countries create and consume. A blockchain also has its own economy: millions of transactions, fees users pay, protocol revenues, DEX operations, liquidations, arbitrage activity, security costs, and cross-chain value flows.
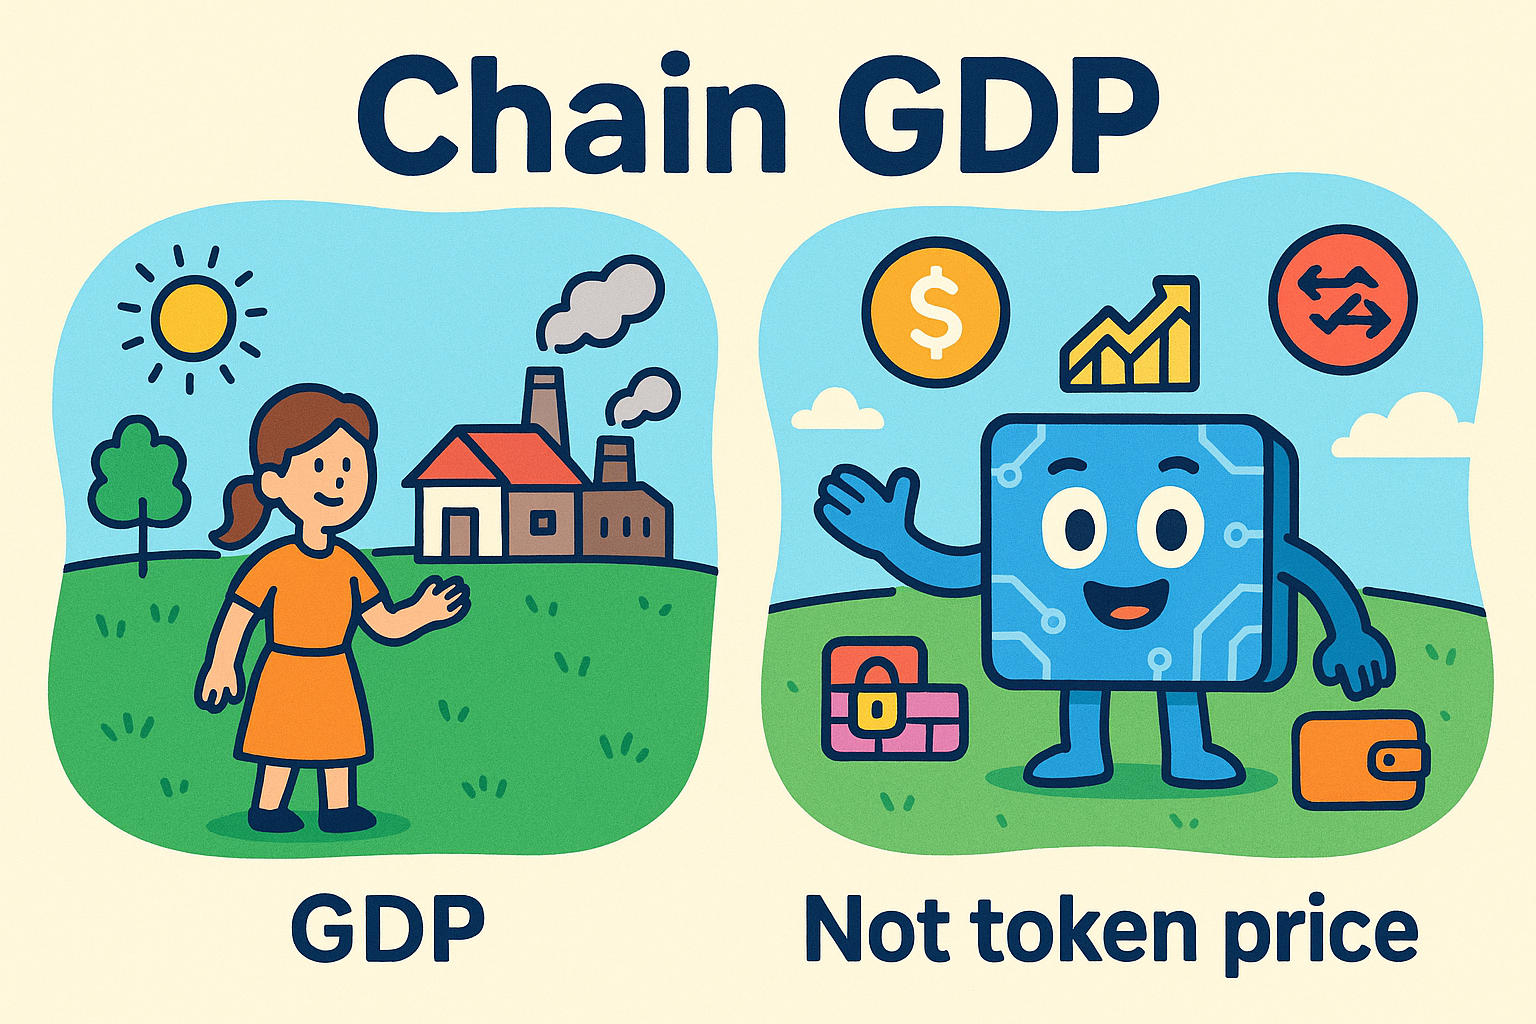
All of this together forms the network’s digital GDP — or Chain GDP. It’s not market cap, not TVL, and not spot trading volume. Instead, Chain GDP shows how a blockchain actually works, whether it creates value, and whether it can be considered a functional digital economy. This is the core of blockchain GDP explained.
We’ll break down this concept so it makes sense even to someone who remembers GDP from school but never thought of blockchains as “countries” with their own macroeconomic systems.
What Is Chain GDP?
Chain GDP is essentially the blockchain’s online GDP — a metric that captures on-chain economic activity produced by a network over a given period.
If you imagine a blockchain as a small digital country, then Chain GDP is the sum of everything happening inside it: how much value moves, what users pay in fees, how much protocols earn, how MEV behaves, and what it costs to maintain security. It’s a practical way to measure blockchain economic output.
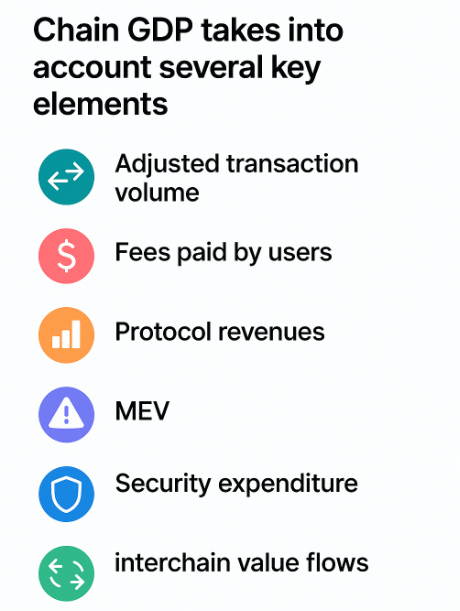
To get a clear and accurate picture, Chain GDP includes several core components of crypto economic activity:
1. Adjusted Transaction Volume — real value transferred
This is not just the number of transactions. It reflects the true on-chain economic value moving through the network.
The raw volume is cleaned from:
- spam transactions,
- bots,
- cyclical wash-flows,
- bridge transit activity,
- compressed L2 batches (when dozens of operations are packed into one).
Adjusted volume shows the real movement of value, not noisy on-chain traffic.
2. Fees Paid by Users (User Fee Revenue)
Every transaction and every smart contract call costs money. Fees are the most direct expression of network productivity metrics — real demand for block space.
In Ethereum, the fee structure includes base fee and priority fee: part is burned (EIP-1559), part goes to validators. In PoS networks, fees form part of validator earnings. This is the digital equivalent of consumption within GDP.
This component is important for protocol revenue explained, because user fees form a core layer of a network’s economic output.
3. Protocol Revenues
These aren’t earnings of the L1 chain itself — they’re revenues generated by on-chain applications: DEXes (Uniswap, Orca), lending markets (Aave, Marginfi), derivatives platforms, stablecoin modules, bridge fees.
For L2 networks, this also includes sequencer revenue:
- L2 gas,
- MEV captured by the sequencer,
- priority fees.
It works similarly to how infrastructure companies generate revenue in traditional economies.
A real-world parallel is user activity that generates revenue streams — like in GoMining collections, where usage creates measurable economic output.
4. MEV (Miner / Maximal Extractable Value)
MEV is the “shadow market” of the blockchain but still a fundamental part of on-chain economic value: arbitrage, liquidations, sandwich-bot strategies.Formula: MEV = Arbitrage + Liquidations + Sandwich Profits
Despite sounding controversial, MEV genuinely creates economic activity — similar to unregulated markets in traditional economies, which still increase turnover and liquidity.
5. Security Expenditure (Validator Rewards)
This is the blockchain’s analogue of government spending. The network pays validators so that: blocks are confirmed, the chain remains secure, attacks are prevented.There’s a debate:
Arguments for including it:
- It’s a real cost of maintaining the network.
- Security is foundational to any economy.
Arguments against:
- It’s a production cost, not output.
- Validator rewards can be purely inflationary.
Most analysts include it separately.
6. Interchain Value Flows
This is value moving between blockchains: Wormhole, LayerZero, Cosmos IBC, cross-chain swaps.
It mirrors Net Exports — what the chain “sells” or “imports” from other ecosystems.
The Core Idea. Chain GDP measures not the token price, but the value the network actually produces every single day — the most honest measure of blockchain fundamentals.
Why Onchain GDP Metric Matters
Chain GDP helps us evaluate blockchains not as charts and speculative tokens, but as emerging digital economies. Some networks look valuable simply because their tokens are actively traded. But if the chain has:
- almost no fees,
- minimal activity,
- empty protocols,
- no capital flows,
then the economy is effectively dead — regardless of market cap.
Chain GDP helps:
- distinguish real networks from inflated ones,
- understand whether a chain is sustainable,
- see whether the ecosystem is alive,
- fairly compare L1 and L2 networks with very different designs.
Also relevant: Bitcoin Rainbow Chart.
Traditional GDP vs. Chain GDP
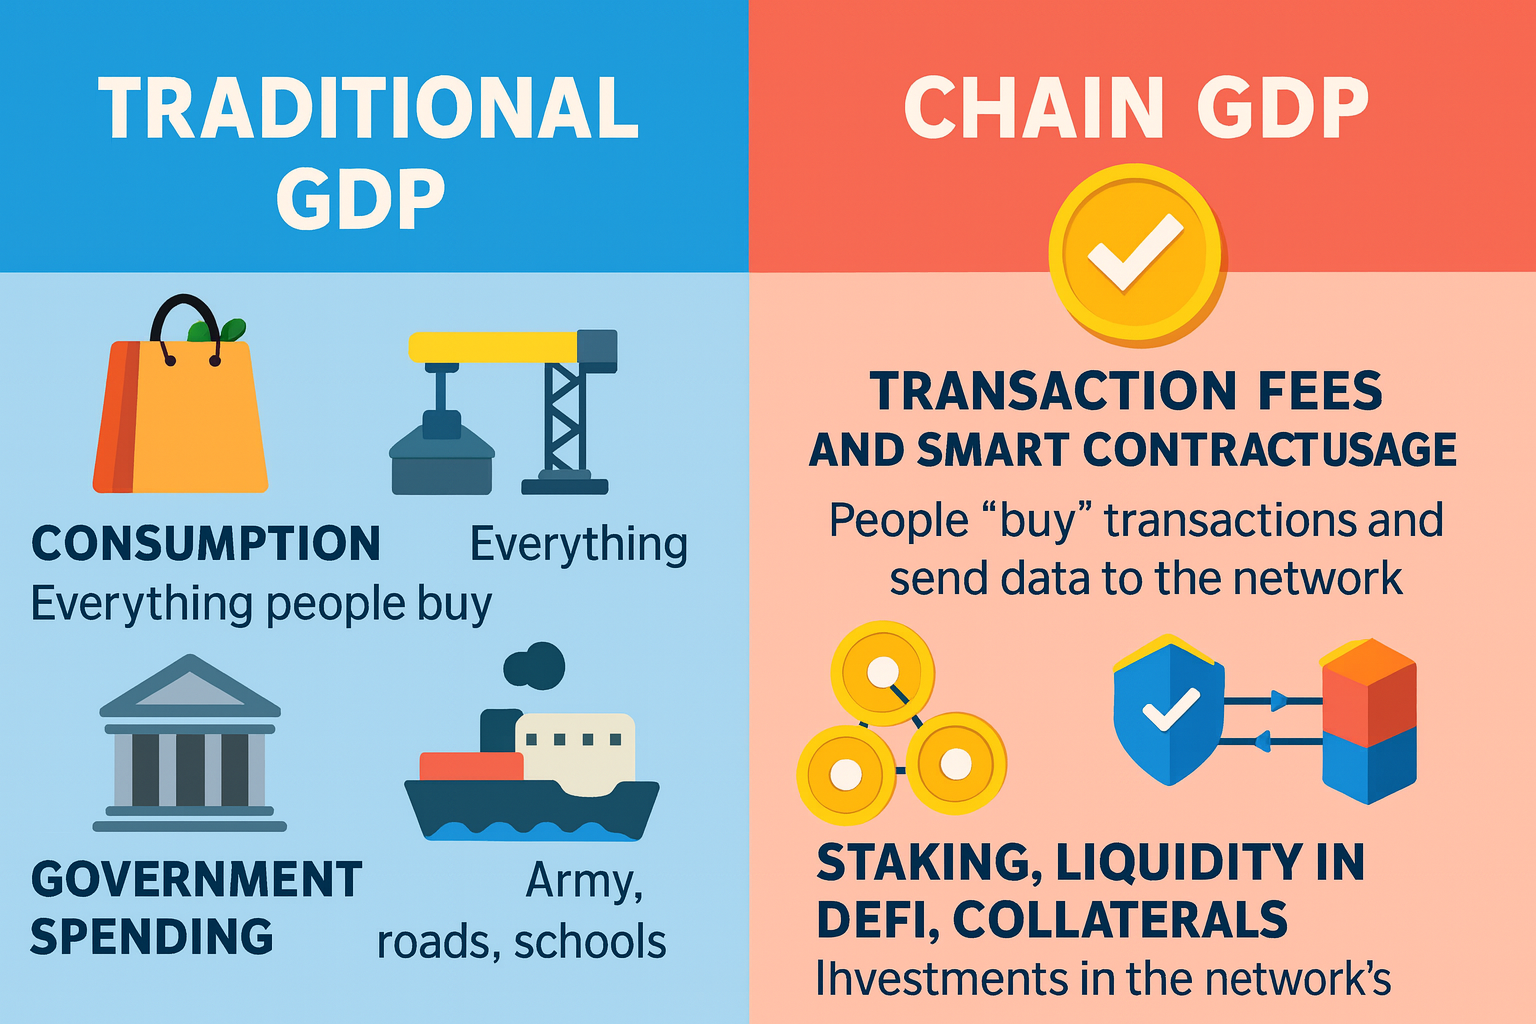
In traditional economics, GDP is calculated using the formula C + I + G + NX. These are the four categories of activity that create value:
- C — Consumption: everything people buy — food, services, clothing.
- I — Investment: construction, equipment, new factories.
- G — Government spending: the army, roads, schools, public services.
- NX — Net exports: what a country sells abroad minus what it imports.
If we translate this logic into the world of blockchains, the structure is almost the same — only the activities become digital:
- C → user fees and smart-contract usage. People “buy” transactions and pay for execution — this is digital consumption.
- I → staking, DeFi liquidity, collateralized positions. These are investments into the network’s infrastructure, similar to building factories but in a digital form.
- G → validator rewards (issuance). The network pays for its own security the same way a government pays for national defense.
- NX → cross-chain value transfers (bridges, IBC). This is the blockchain equivalent of international trade — one chain “exports” value to another.
Where the Analogy Breaks
The comparison works well, but not everywhere:
- Blockchains don’t produce physical goods — they generate infrastructure value.
- Tokens circulate far faster than national currencies — classic monetary theory doesn’t map cleanly.
- Market cap ≠ economic output, just like the price of gold is not the same as a country’s economy.
That’s why Chain GDP isn’t a copy of traditional GDP — it’s an adapted framework designed for digital networks.
How to Calculate Chain GDP
Calculating Chain GDP is actually simpler than it looks. If you explain it directly, it’s just the sum of all real economic activity a blockchain generates over a certain period — a day, a week, a month.
To get the final number, you take several core components and add them together. Think of it as the network’s version of digital GDP. Here’s the basic formula:
Chain GDP = Adjusted Transaction Volume
+ User Fee Revenue
+ Protocol Revenue
+ MEV Captured
+ Security Expenditure (optional)
Each part represents a different piece of the network’s economy:
- Adjusted Transaction Volume — how much real value moves inside the chain, cleaned from bots and spam.
- User Fee Revenue — the fees users pay. This is the most direct measure of demand for the blockchain.
- Protocol Revenue — the income generated by apps: DEXes, lending markets, bridges, derivatives platforms, L2 sequencers.
- MEV Captured — profit from arbitrage, liquidations, and other automated strategies.
- Security Expenditure (optional) — what the network spends on its own security: validator rewards.
There are two important things to understand:
1. Chain GDP is not TVL
TVL shows how much capital is sitting in smart contracts. Chain GDP shows how much the network produces. It measures activity — not reserves.
2. Chain GDP is not market cap
Market cap depends on token price. Chain GDP measures the actual work the network performs each day.
If you compare them with everyday things:
TVL is like the amount of money locked in safes. Market cap is like the price of a company’s shares. Chain GDP is the revenue and economic activity the system actually generates.
Data Sources
To combine all these components, analysts pull data from several different sources. Some of it comes from public blockchain explorers, some from analytics platforms, and some from internal models. Here are the typical sources they rely on:
Blockchain explorers: Etherscan, Solscan, TronScan, Tonscan.
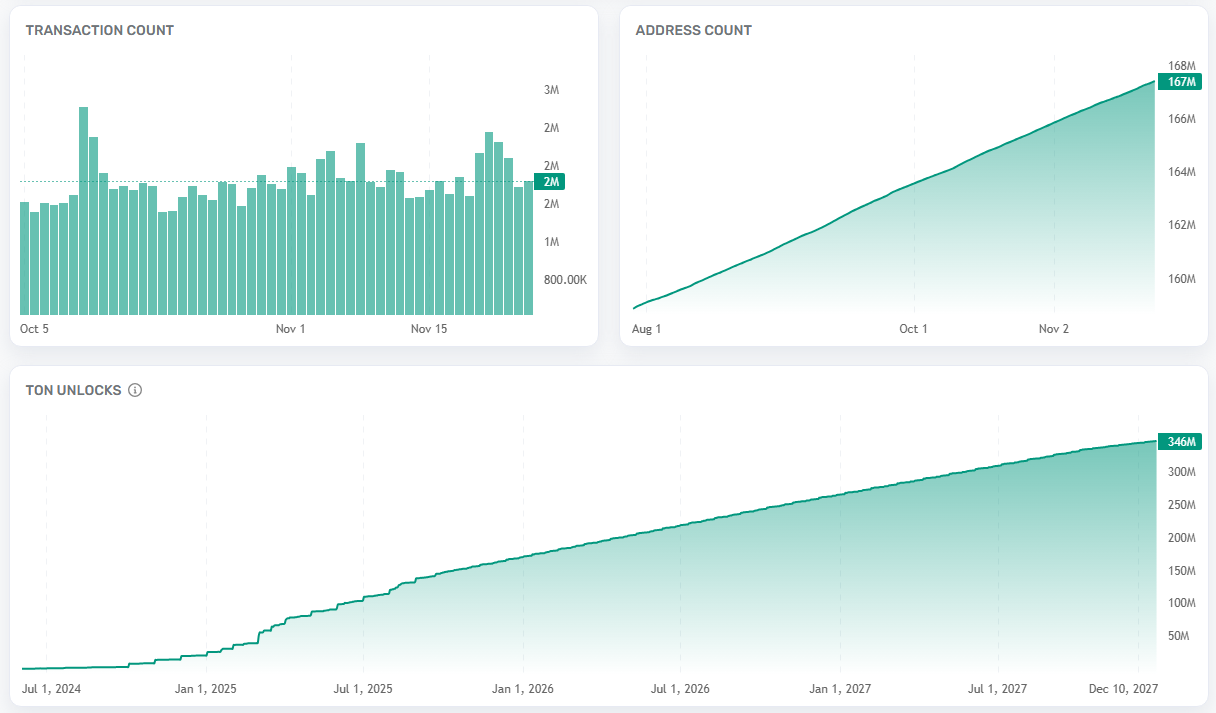
Source: tonscan.org
Dune dashboards — used for visualizations and SQL-style queries across different blockchains.
TokenTerminal — the main source for protocol revenue, MEV data, fee economics, and on-chain profitability metrics.
MEV analytics — for example, Flashbots dashboards, EigenPhi, or various mempool explorers. These tools provide data on liquidations, arbitrage flows, and sandwich-trade profits.
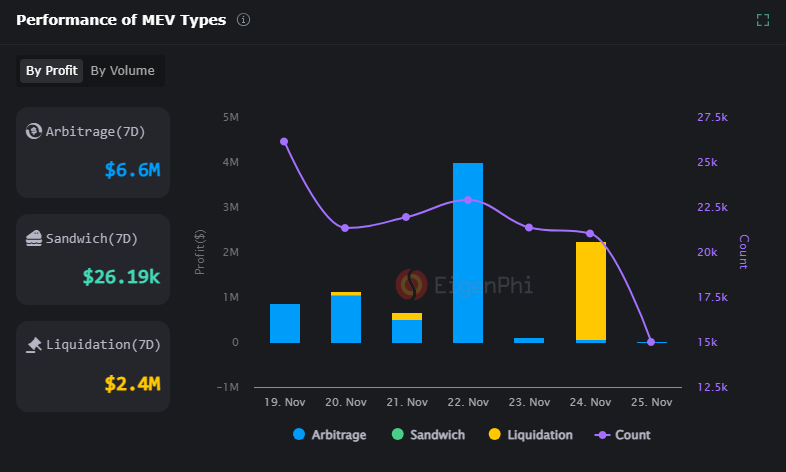
Source: eigenphi.io
L2 sequencer dashboards. For example: Arbitrum, Base, Optimism, zkSync — each network has its own explorer and a dedicated panel that tracks sequencer revenue. CPU fees + MEV + priority fees make up the majority of an L2’s economic activity.
Custom analytical models. Analysts sometimes build their own models because not all data is available in a clean, ready-to-use format. For instance, it can be difficult to extract a correct adjusted volume or to calculate the true “cost of security” directly from public sources.
These sources together provide the factual basis for measuring on-chain economic value.
Examples — Case Studies
Ethereum
Ethereum is the clearest example of a mature digital economy with a strong on-chain economic output. Several factors form its unusually high Chain GDP:
1. High fees → strong GDP contribution. Gas fees in Ethereum are among the highest in the industry. This immediately boosts GDP because users pay real money for real block space.2. A highly developed MEV market. Ethereum has one of the most sophisticated MEV ecosystems — arbitrage, liquidations, priority auctions, bundles. This “shadow economy” creates additional economic activity that no other L1 matches at scale.3. Data availability (DA) costs from L2 networks. Ethereum acts as a settlement and data layer for L2 rollups. When L2 networks publish data to Ethereum, they generate measurable expenses — effectively government-supported infrastructure demand.
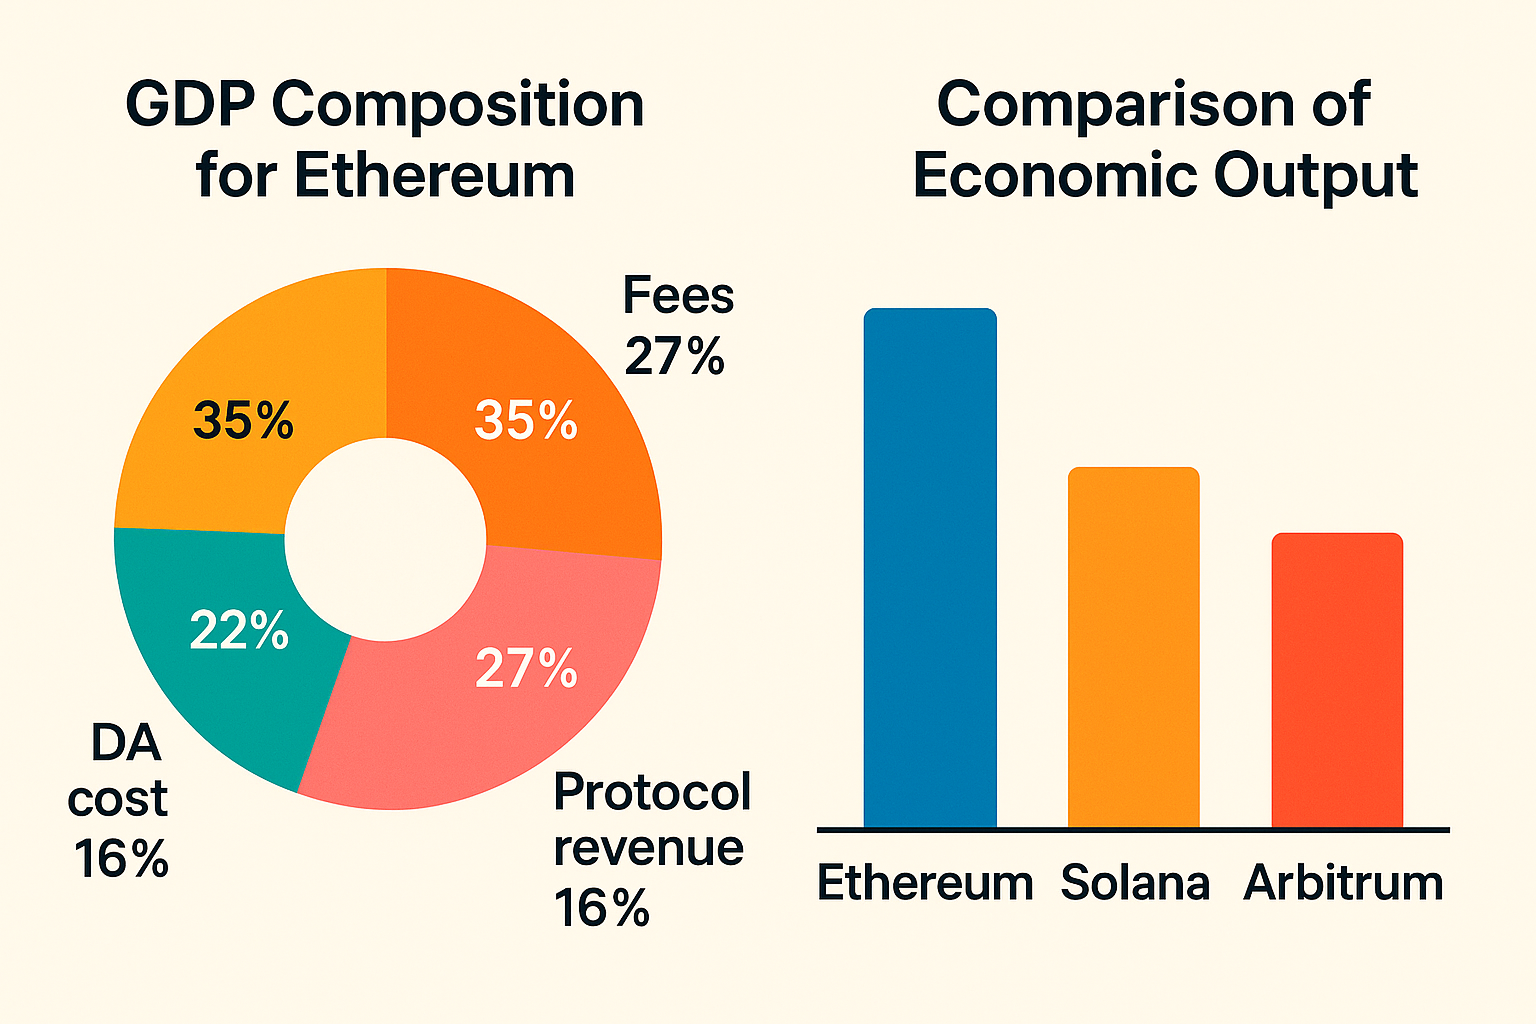
All of this together makes Ethereum one of the strongest and most productive digital economies in the blockchain sector.
Solana
Solana follows a very different model, which directly affects its Chain GDP profile.
1. Extremely low fees. Because transactions cost fractions of a cent, user-fee revenue contributes far less to GDP than in Ethereum. For Solana, fees alone do not reflect network usage.2. GDP depends more on protocol activity. Key drivers include: DEX volume (especially AMM and orderbook hybrids), NFT markets, memecoin activity, revenue from high-frequency protocols.3. High throughput → adjusted volume becomes critical. Solana processes tens of thousands of transactions per second, but a large share of them are bots, quote updates, arbitration loops.4. Because of that, adjusted transaction volume is especially important — raw volume would distort the picture dramatically. Solana’s Chain GDP is shaped not by fees, but by activity inside its applications.
L2 Networks (Arbitrum, Base, Optimism)
L2 rollups have a unique economic structure, so their Chain GDP looks different.
1. Main revenue source → sequencer revenue. L2 sequencers earn money from: L2 gas fees, MEV they capture, priority fees for inclusion.2. This is the “engine” of L2-level GDP.3. Dependence on Ethereum. Every L2 network must pay for: L1 gas (posting proofs and data), data availability (DA cost).4. These expenses are a built-in “export tax” to Ethereum — similar to a country that relies on imported infrastructure services.5. GDP growth = protocol expansion + sequencer income. As L2 ecosystems grow (DEXes, social apps, memecoins, perps platforms), their protocol revenue expands. This growth shows up directly in Chain GDP metrics.
L2s are best compared not to L1s, but to cities inside a country that rely on a central government (Ethereum) while generating their own local economy.
Why Chain GDP Matters
Understanding Chain GDP helps evaluate blockchains as real economies, not just speculative assets.
For Investors
Chain GDP shows which networks produce real value and which ones simply have a “popular token.” It’s a fundamental metric, similar to GDP in traditional countries, that helps distinguish speculation from meaningful activity.
If you want to evaluate networks from a yield or mining-economics perspective, tools like the GoMining reward calculator are useful: https://gomining.com/calculator
For L1 / L2 Teams
For developers and ecosystem teams, Chain GDP is an objective measure of network progress. It helps assess:
- whether upgrades worked,
- whether changes to gas pricing made sense,
- whether protocol activity grew,
- whether the ecosystem became more productive.
This is a “dashboard” for tracking digital-economy health.
For Institutions
Institutional players do not look at hype — they look at value creation. For them, Chain GDP is becoming a standard analytical metric, similar to revenue in traditional finance.
It shows whether a blockchain can support real economic activity, not just token speculation.
Limitations of Chain GDP
Like any metric, Chain GDP does not show everything. It does not capture:
- token value as a store of value,
- market capitalization,
- off-chain activity (developers, GitHub, research, tooling),
- spot trading on centralized exchanges.
In other words, Chain GDP measures only on-chain production, not the entire ecosystem. It’s a precise and grounded metric, but not a universal one.
Summary
Chain GDP represents the next step in understanding the structure of blockchain economies. As networks mature, this metric helps identify which chains truly create value and which ones depend solely on speculation.
The next evolution is the concept of Chain GVA (Gross Value Added) — an even more detailed measurement of how much net value different sectors of a blockchain economy generate.
Just as countries compete by productivity, blockchains increasingly compete as digital states with their own economies, infrastructure, exports, and internal markets.
Chain GDP is becoming a fundamental indicator — standing alongside market cap — for evaluating the economic health of a blockchain network.
Telegram | Discord | Twitter (X) | Medium | Instagram
FAQ
1. What is Chain GDP in simple terms?
Chain GDP is the amount of real economic value a blockchain creates — fees, protocol revenue, MEV, on-chain activity. It’s like GDP for digital networks.
2. How is Chain GDP different from market cap?
Market cap shows how much a token costs. Chain GDP shows how much the network produces. Price ≠ productivity.
3. Is Chain GDP the same as TVL?
No. TVL measures locked capital. Chain GDP measures economic output over time.
4. Why is adjusted transaction volume used instead of raw volume?
Because raw volume includes bots, spam and wash-loops. Adjusted volume shows the real movement of value.
5. Why does MEV count as economic activity?
Because arbitrage, liquidations and other MEV strategies move capital and generate revenue — just like informal markets in real economies.
6. Should validator rewards be counted in Chain GDP?
Depends on methodology:
- some include it (security is essential to the network),
- others exclude it (it’s a cost, not output).
7. Why do L2 networks have a different GDP structure?
Because their main revenue comes from sequencer fees and they pay DA/Gas costs to Ethereum. They function like “cities” inside an L1 “country”.
8. Why does Chain GDP matter to investors?
It helps identify which networks generate real value — not just hype or speculation.
9. Can Chain GDP predict long-term sustainability?
Yes. Networks with strong, diversified GDP tend to have healthier and more resilient ecosystems.
10. What does Chain GDP not measure?
- token store-of-value
- market cap
- off-chain activity
- centralized exchange trading
- developer ecosystem
It only measures on-chain productivity.