Crypto Indexes Definition
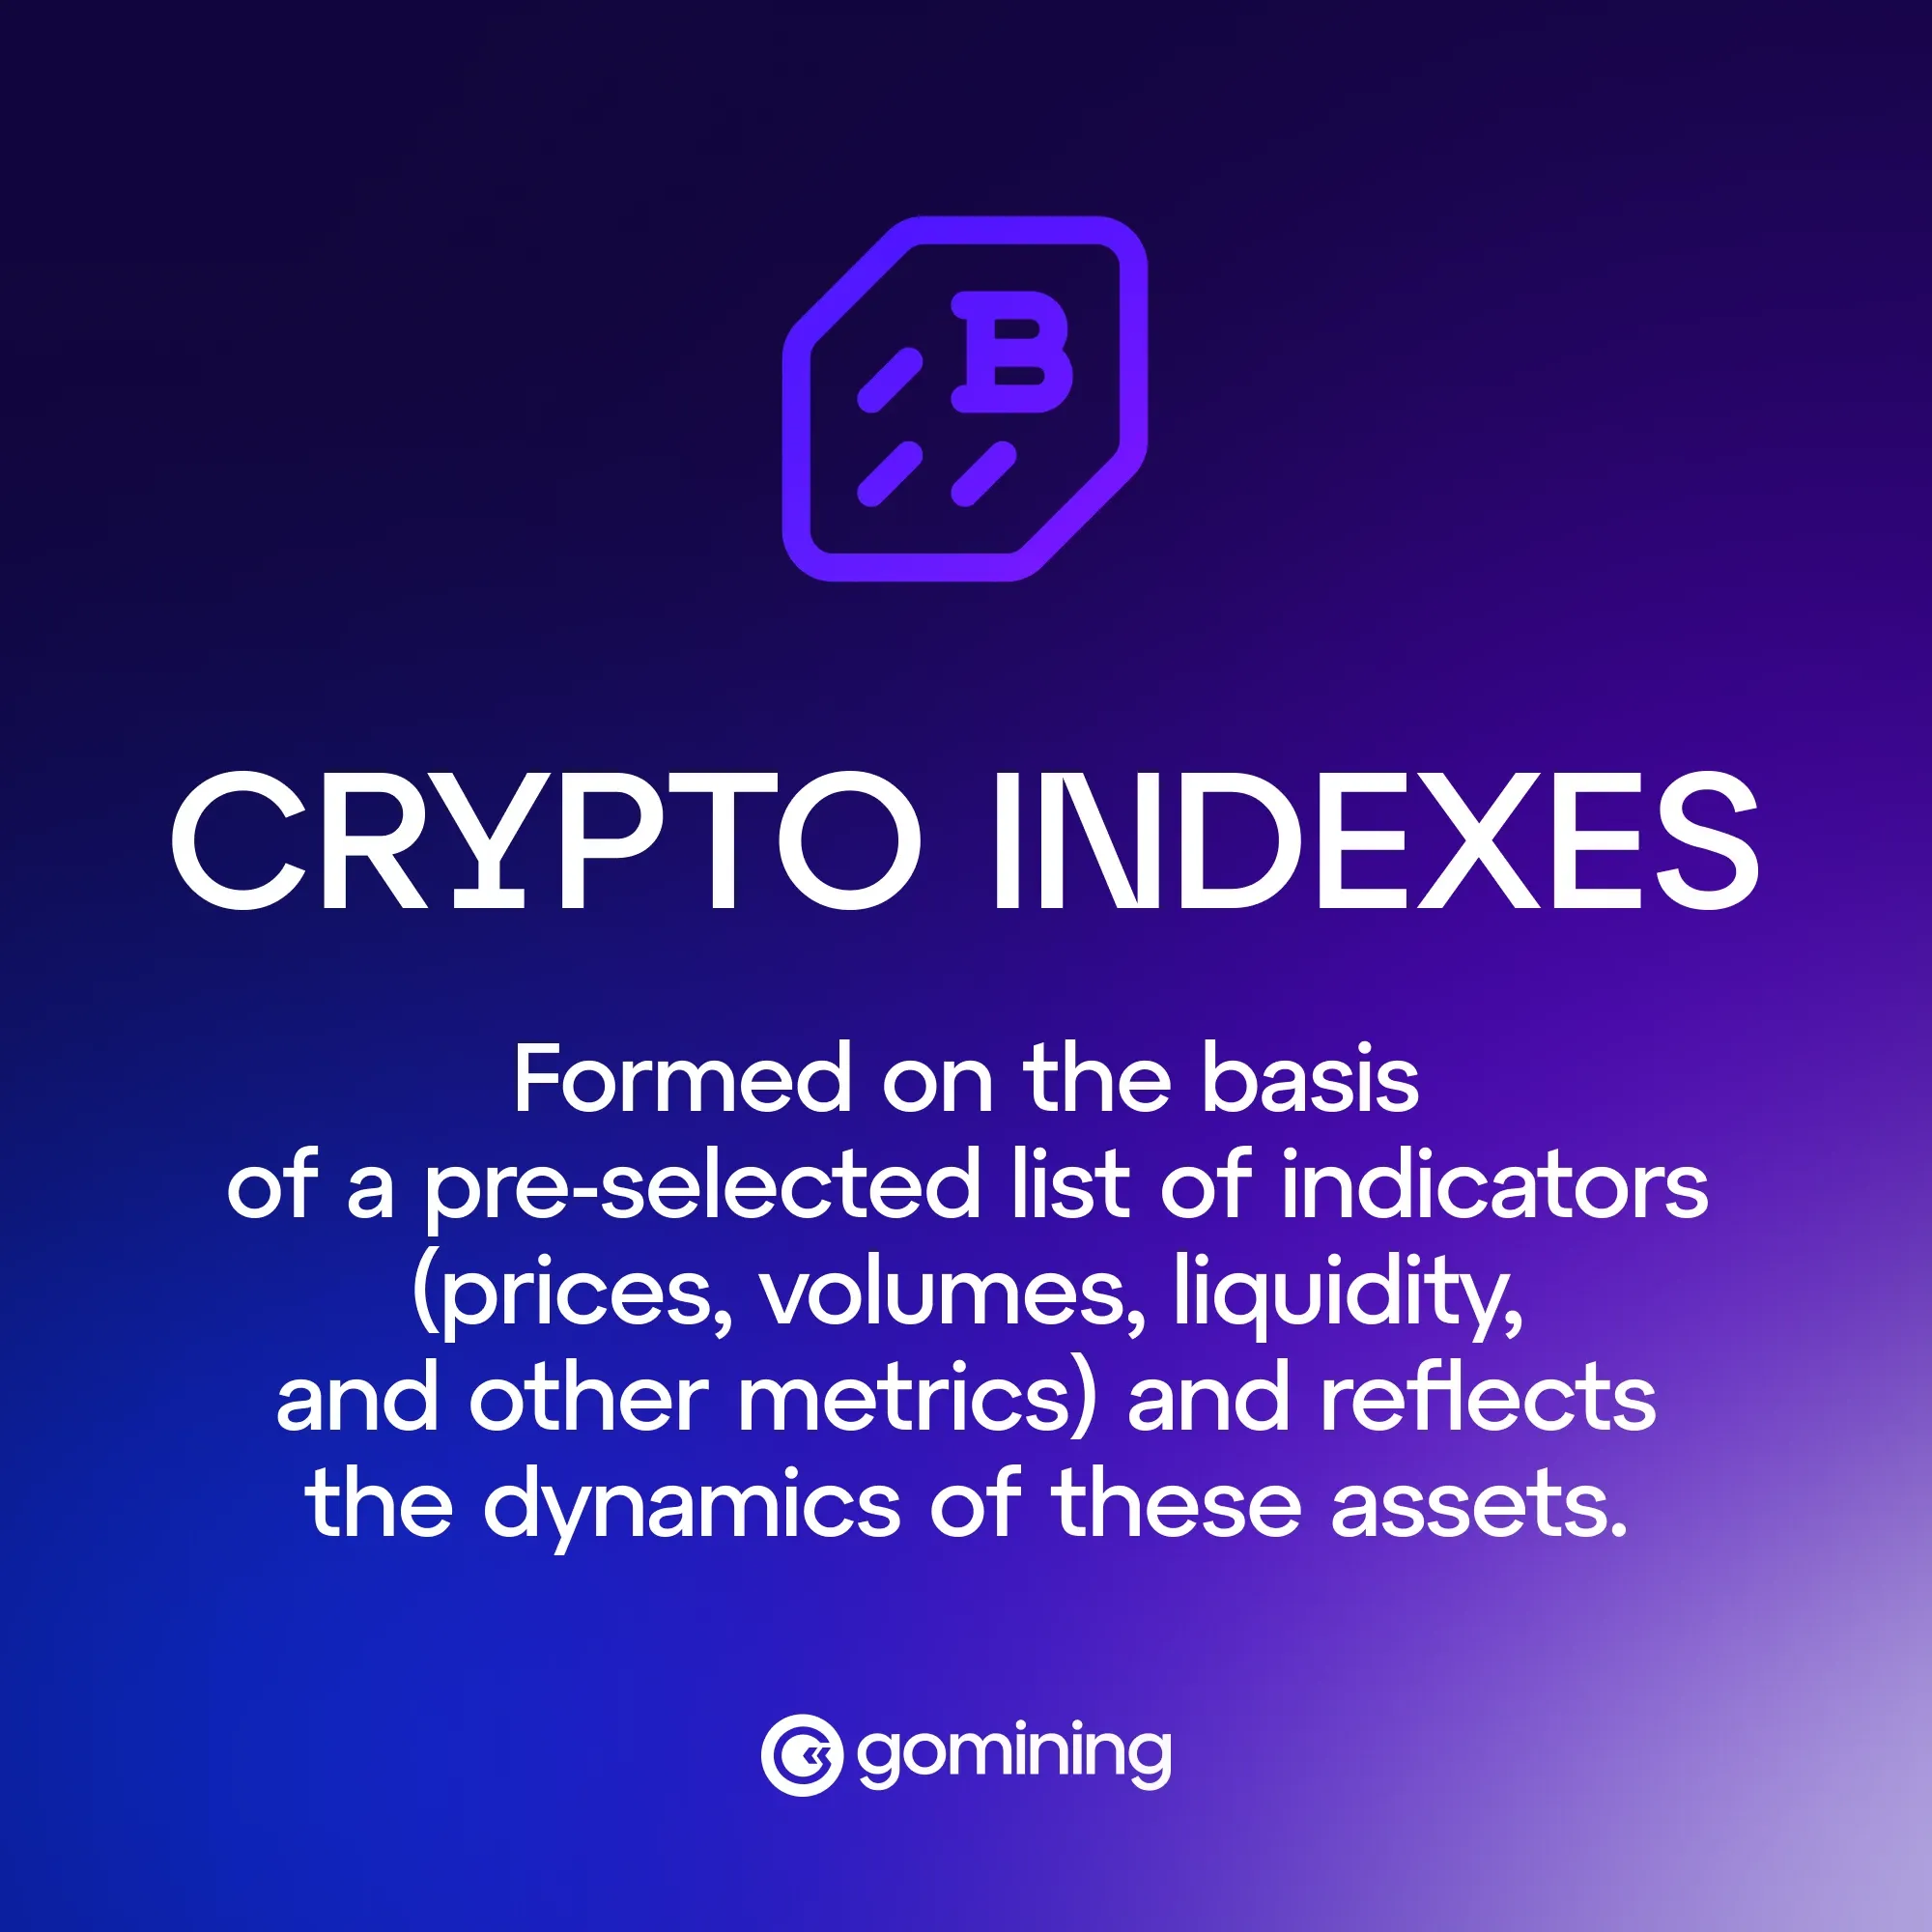
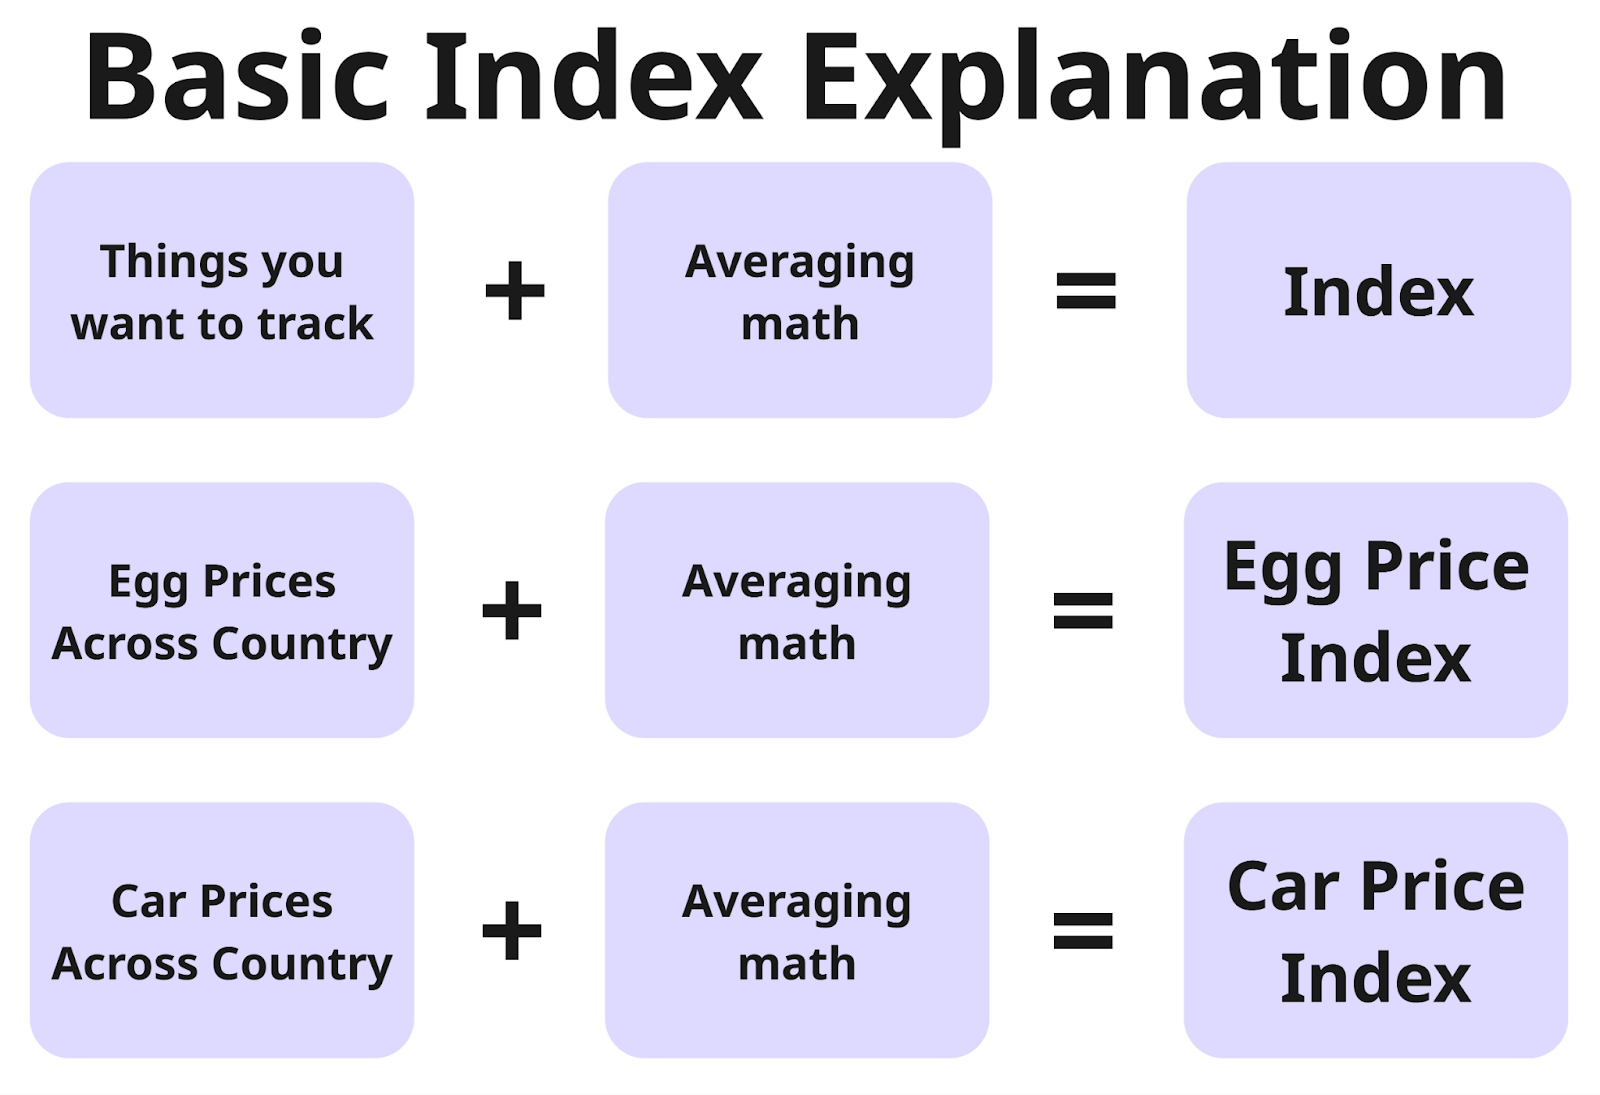
Cryptocurrency index — formed on the basis of a pre-selected list of indicators (prices, volumes, liquidity, and other metrics) and reflects the dynamics of these assets.
The index rises when its components rise and falls when they lose value. Similar to the well-known S&P 500, which takes into account the top 500 companies, the cryptocurrency equivalent is the Crypto Market Index 10 (CMI10), which tracks the dynamics of the 10 largest cryptocurrencies by capitalization. Such indices are often created independently by any market participants who collect data and supervise the indicator on their resources.
S&P 500 is one of the largest and most popular stock indices in the US, which includes the 500 largest public companies in the country.
Source: GoMining
Data sources for cryptocurrency indices
Most cryptocurrency transactions are conducted on exchanges, both centralized and decentralized. These trading platforms are the main sources of information for websites that calculate indices. It is worth noting that prices for the same coin may vary depending on the current supply and demand on a particular exchange.
Source: GoMining
To ensure the most accurate indicators, index platforms collect data from multiple exchanges simultaneously. A list of all trading platforms where a particular cryptocurrency is available can usually be found in the “Markets” tab.
Public APIs — interfaces for transferring data between platforms — are used to collect information. The following indicators are taken into account in the monitoring:
1. Cryptocurrency prices on different exchanges.
2. Volumes of individual transactions.
3. Coin tickers (e.g., BTC, ETH).
4. Timestamps recording the exact moments of transactions.
5. Exchange rates between cryptocurrencies.
How indices affect the price of cryptocurrency
Crypto indices show the overall state of the market. Traders and investors use their dynamics to assess the mood of market participants and understand which direction the market may move in next. For example, an increase in the Bitcoin dominance index often means that capital is flowing from altcoins to BTC, strengthening its position.
The cryptocurrency market largely follows the big players. When prices rise, retail investors start buying actively, further driving up the rate. When prices fall, the opposite happens — sales increase. This leads to the effects of FOMO (fear of missing out) and FUD (fear, uncertainty, and doubt), which push participants to make emotional decisions.
Indices help to see such moments in advance and understand how overheated the market is or, conversely, whether it is in a state of fear.
Advantages of crypto indices
1. Crypto indices simplify market trading and help reduce risks. One of the key advantages is diversification. Instead of betting on a single coin, funds are distributed among several assets, which reduces the impact of sharp price fluctuations of a particular cryptocurrency.
2. Another advantage is convenient access to the market. You don't need to buy and store dozens of different coins to monitor the overall situation or participate in market movements. It is enough to work with a single index or index instrument.
3. Crypto indices also help to better manage risks. They provide a more comprehensive view of the market and allow you to make decisions based on overall dynamics rather than emotions. This is especially useful during periods of high volatility.
In addition, indices provide a simple way to track market conditions without having to analyze each asset in detail. Indices traded on major platforms are usually highly liquid and have transparent calculation rules, which increases confidence in such instruments.
Index calculation and methodology
There are several ways to calculate crypto indices, similar to traditional stock indices:
1. Price-weighted index. In this case, the prices of all coins included in the index are added up and divided by their number. This method is similar to the calculation of the Dow Jones family of indices.
2. Capitalization-weighted index. The index value is obtained as the sum of the market capitalization of all assets divided by a special divisor. The divisor is chosen so as to historically maintain the continuity of the index. This takes into account not only the price of each coin, but also its market share. An example of a classic index of this type is the S&P 500.
3. Equal-weighted index. Here, percentage changes in all assets in the basket are taken into account equally, regardless of their market capitalization. Each coin has the same weight, which allows you to see the dynamics of all market participants on an equal footing.
Modern indices, including the S&P 500, often offer several calculation options: both capitalization-weighted and equally weighted, so that investors can analyze the market from different angles.
Dow Jones is one of the oldest and most famous stock indices in the world. It reflects the dynamics of the share prices of 30 of the largest and most influential US companies, such as Apple, Microsoft, and Coca-Cola.
Popular cryptocurrency indices
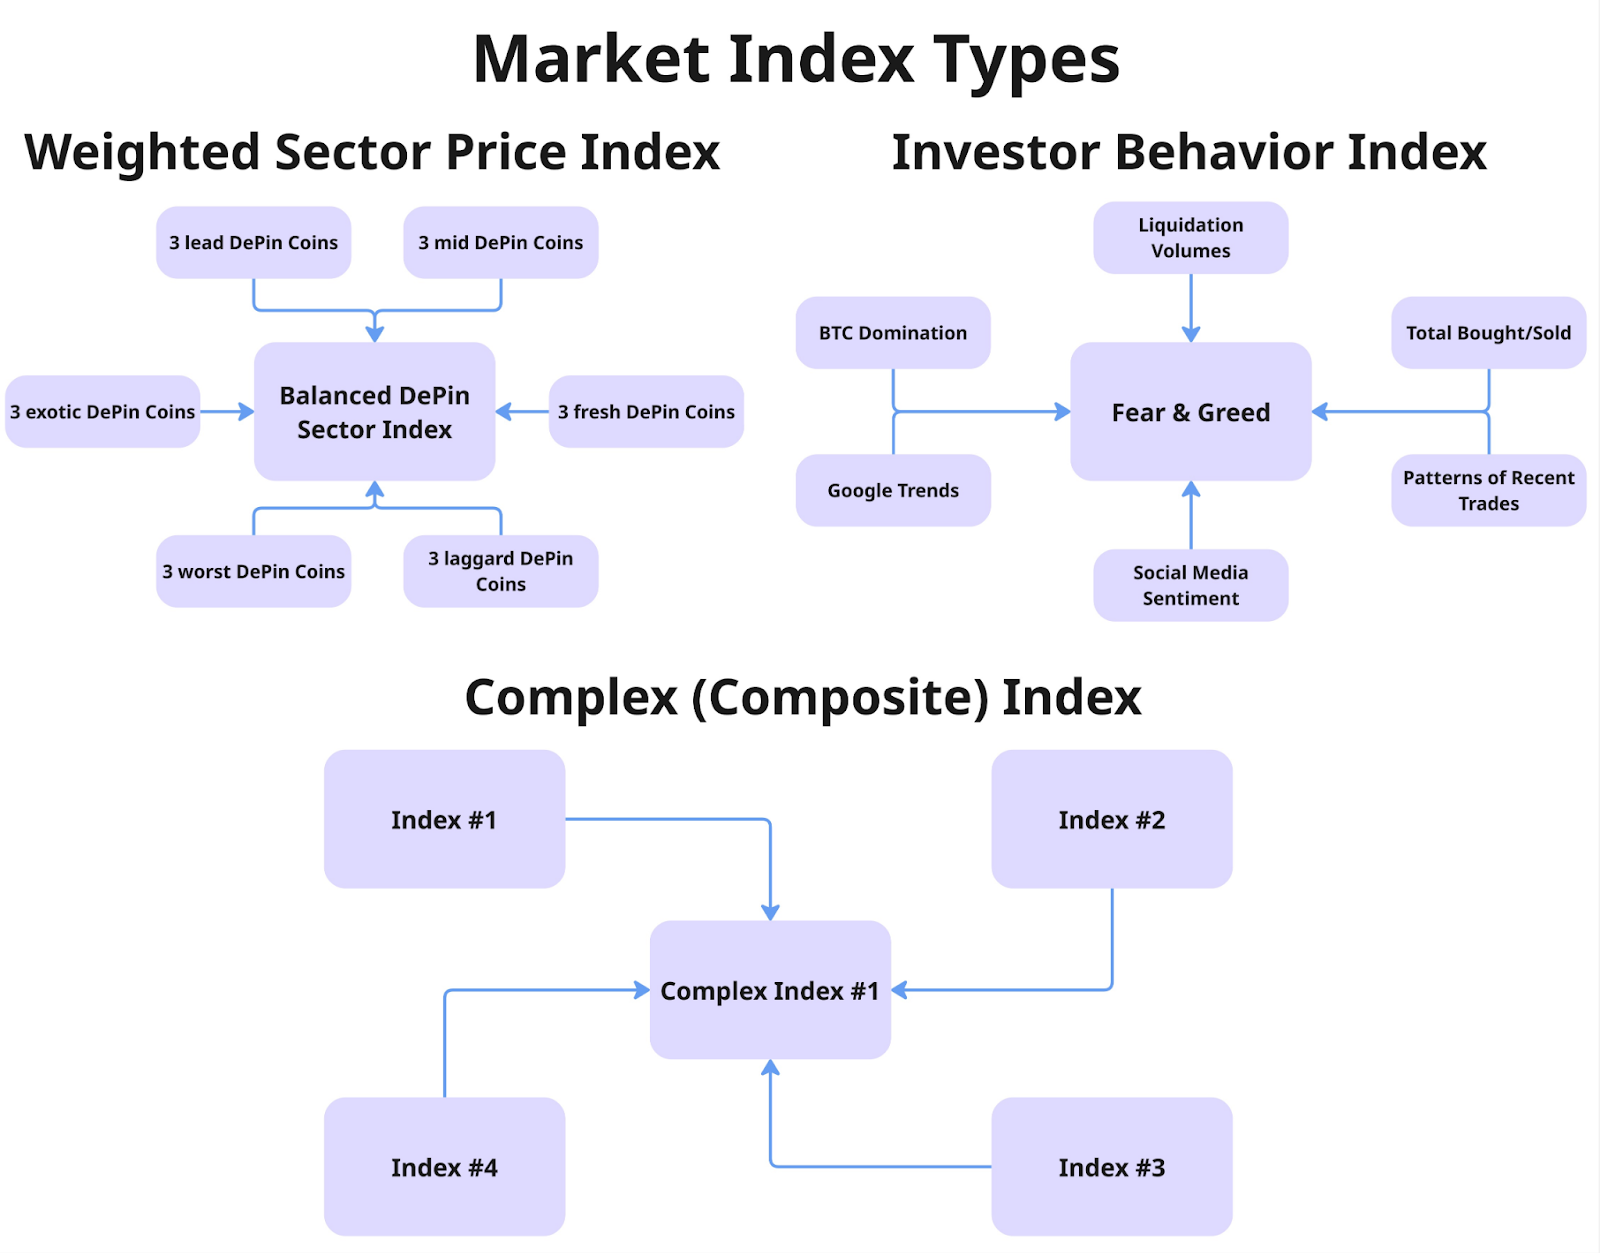
1. The Fear and Greed Index is an analytical indicator designed to assess two key emotions that influence investor behavior. Fear and greed shape market sentiment and largely determine how much participants are willing to overpay for assets.
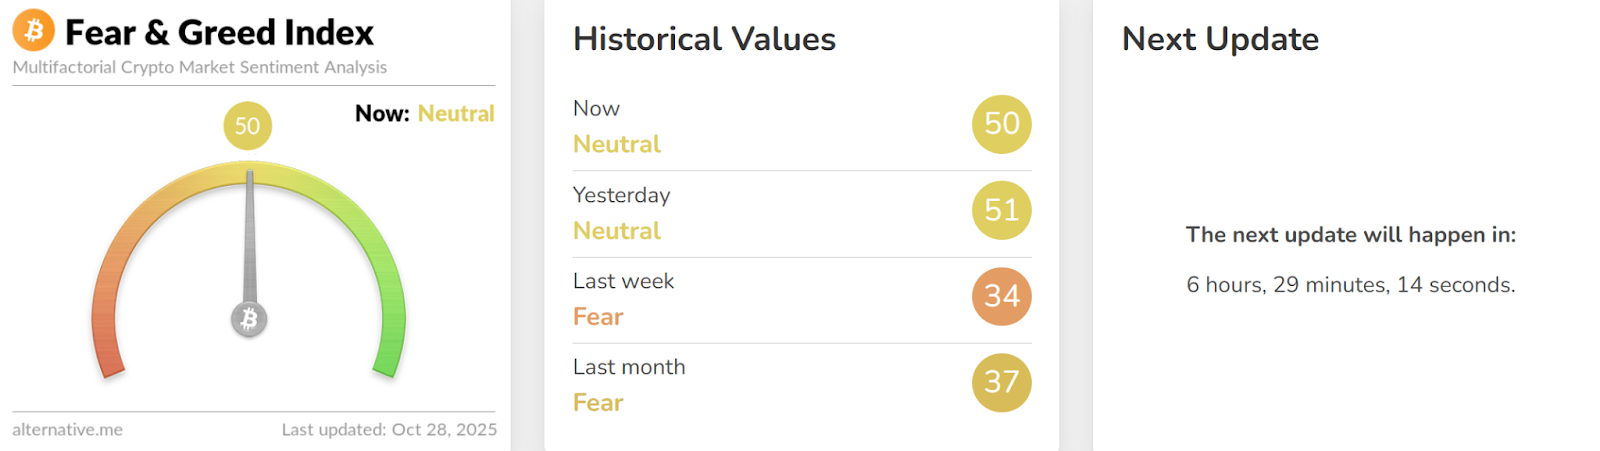
Source: Alternative.me2. Cryptocurrency Capitalization Index (MarketCap Index). Market capitalization directly depends on changes in the prices of digital currencies. It is calculated as the sum of the value of all coins and tokens in circulation.
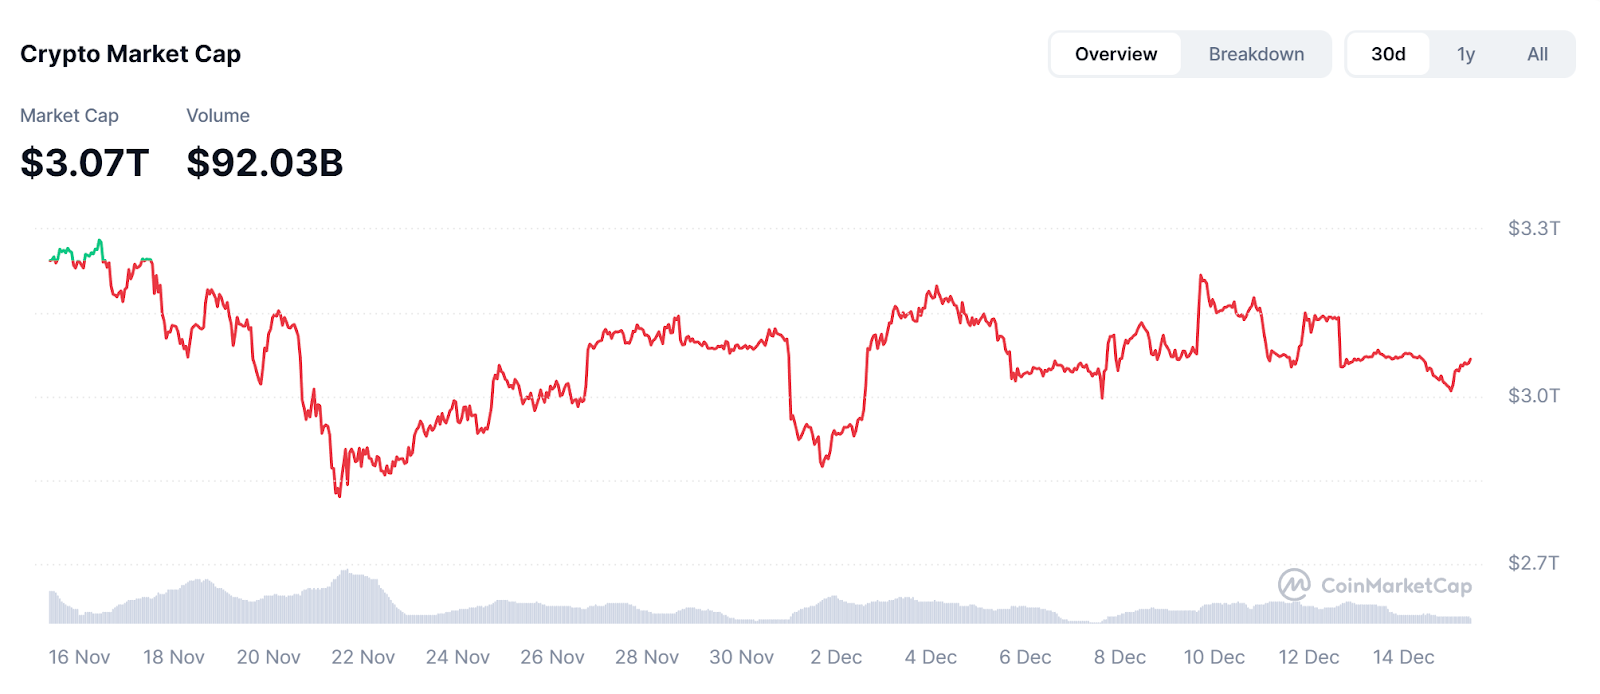
Source: Coinmarketcap.com3. Bitcoin Dominance Index. Shows the market share of Bitcoin compared to other cryptocurrencies. A decline in this indicator is often seen as a sign of the approaching altseason — a period of active growth in altcoin prices.
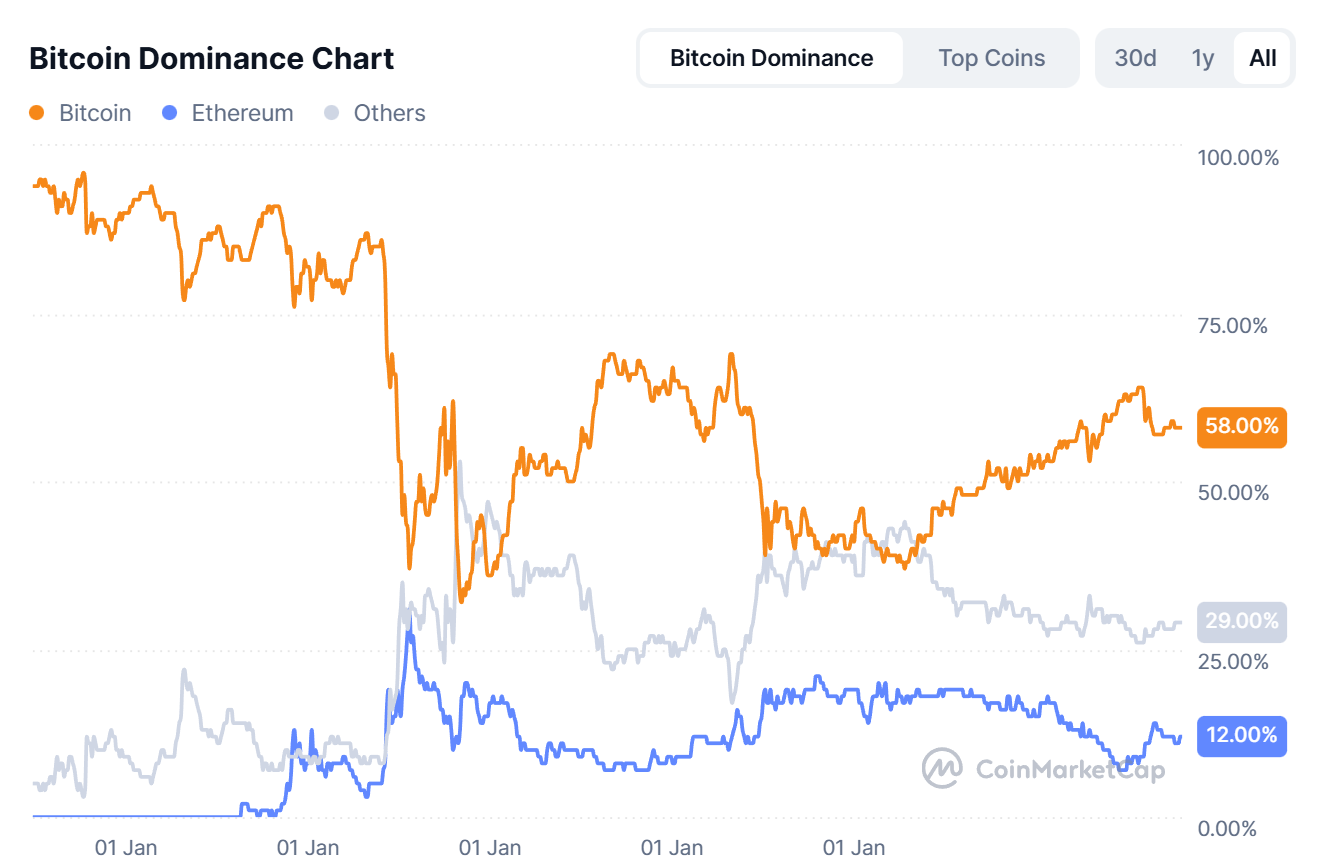
Source: Coinmarketcap.com
Analysis and use of cryptocurrency index data
Different index platforms provide information tailored to the needs of users. Traders are usually interested in the maximum and minimum price values for the last 24 hours. Long-term investors are more likely to focus on the technical characteristics of assets, such as the operating algorithm, transaction fees, and other indicators.
All services also reflect key information about digital currency:
1. Current exchange rate.
2. Cost of available trading supply.
3. Total trading volume over the past 24 hours.
Calculating cryptocurrency index price
Indices usually reflect daily changes in asset values. To do this, they use the volume-weighted average price (VWA), which shows the average cryptocurrency rate, taking into account the volume of transactions over a certain period.
Source: Crypto.ru
How the Index Price of cryptocurrency is calculated
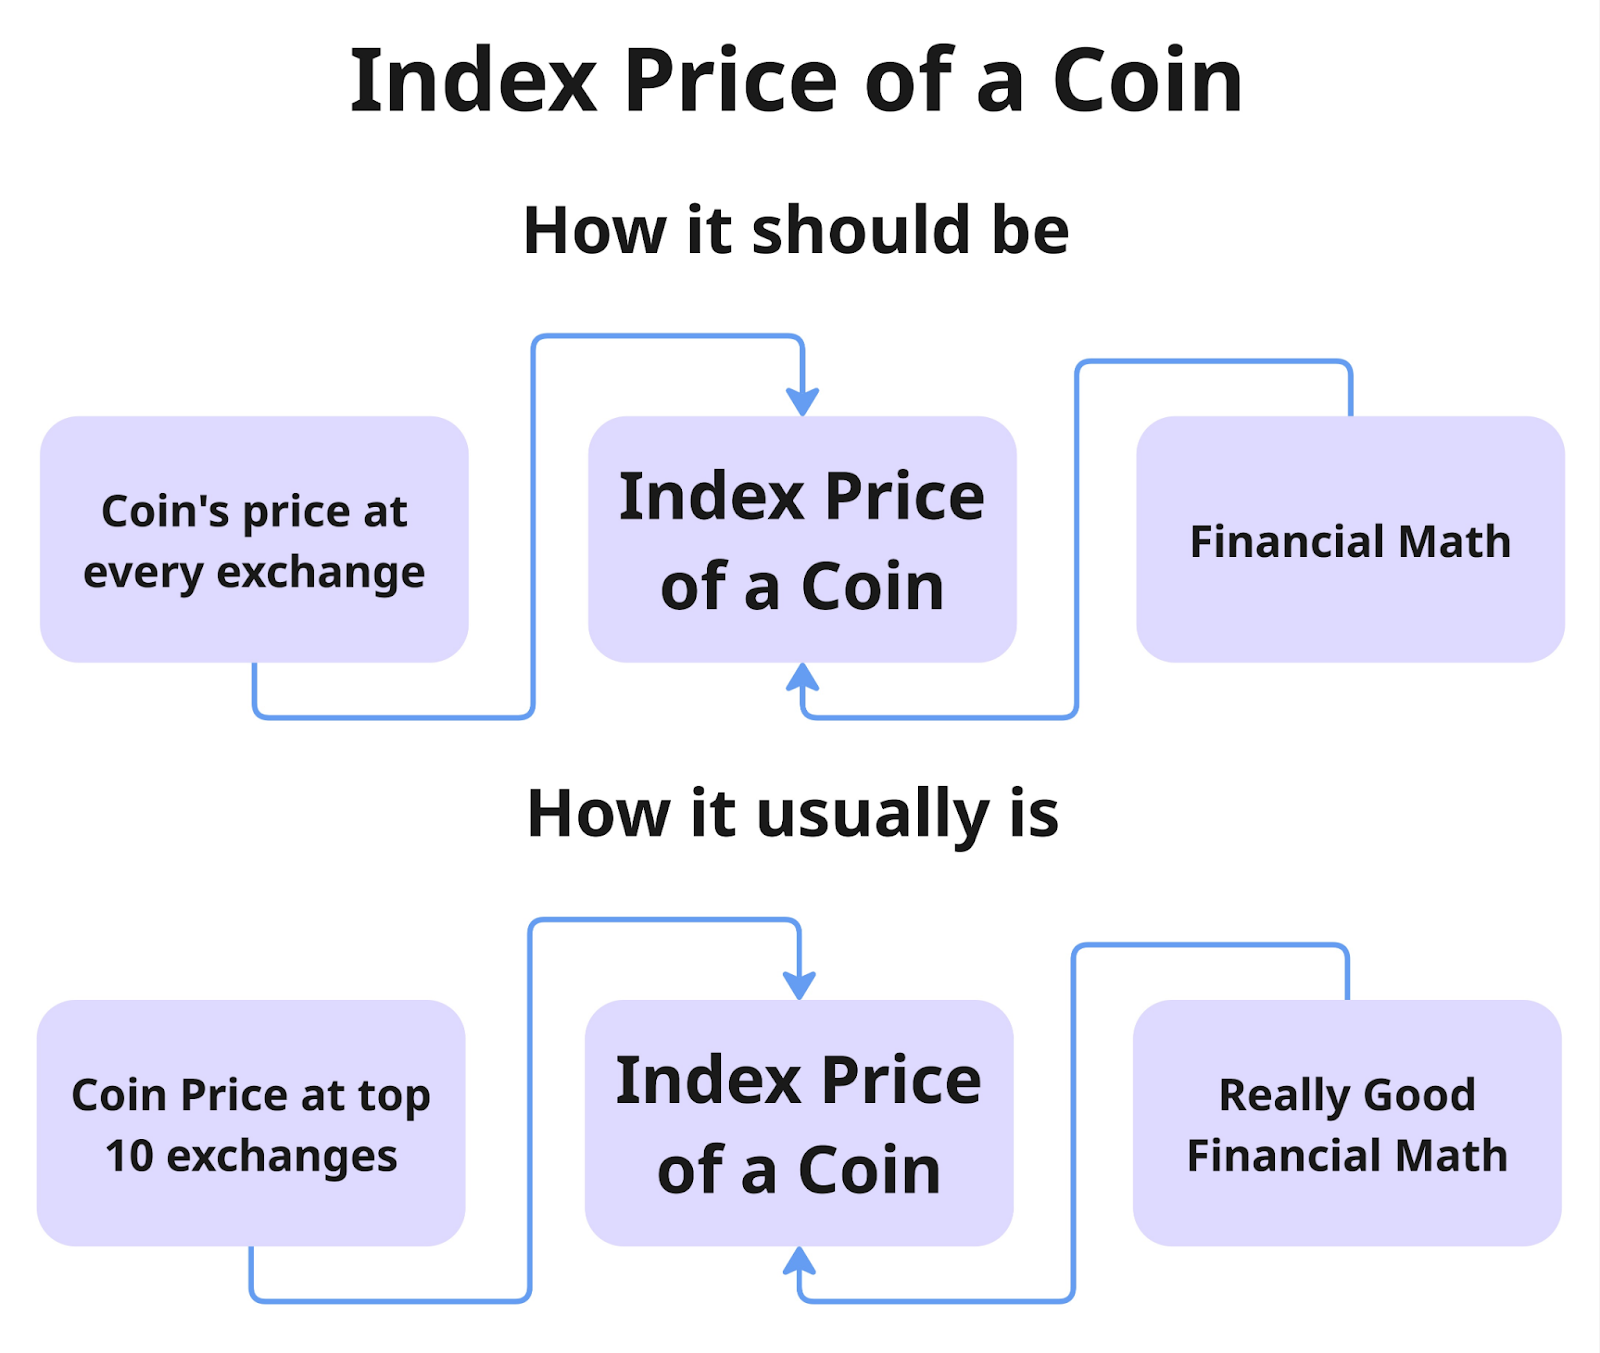
Source: GoMining
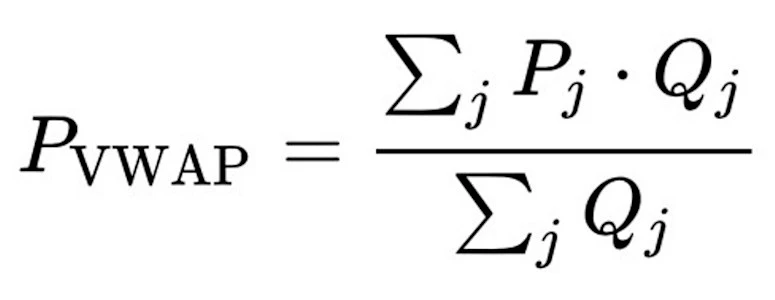
The following symbols are used to calculate the volume-weighted average price (VWAP):
1. Pvwap — volume-weighted average price.
2. Pj — price of a single transaction.
3. Qj — number of units of the asset in a given transaction.
4. j — number of each transaction in the selected period.
5. ∑ — sum of all transactions for the period.
The formula allows you to determine the average price of a cryptocurrency, taking into account the volume of each transaction, which makes the indicator more accurate for market analysis.Subscribe and get access to the GoMining course on cryptocurrency and Bitcoin, which is still free: https://academy.gomining.com/courses/bitcoin-and-miningNFA, DYOR.
The cryptocurrency market operates 24/7/365 without interruptions. Before investing, always do your own research and evaluate risks. Nothing from the aforementioned in this article constitutes financial advice or investment recommendation. Content provided «as is», all claims are verified with third-parties, credible sources and relevant in-house and external experts. Use of this content for AI training purposes is strictly prohibited. Use of content for AI citations is allowed only with explicit links to the original article being quoted on GoMining.com website. Telegram | Discord | Twitter (X) | Medium | Instagram
January 5, 2026