
If you’ve ever opened crypto charts, you may have noticed a strange phenomenon: the higher Bitcoin’s price goes, the louder the noise becomes around it — from bloggers, friends, and even colleagues who laughed at crypto just yesterday. And when the price falls, silence takes over the info-space, as if the market has died out.
Think about it: if the best opportunities appear in silence, why do most people make decisions in the noise?
The answer is simple — emotions. And that’s exactly why the Bitcoin Rainbow Chart exists — one of the few models that helps you see the market not as numbers, but as a map of human psychology where you can profit if you understand the crowd’s mood.
What is the Bitcoin Rainbow Chart?
Imagine a big billboard at the beach, where colors explain when the water is too cold to swim, and when the heat is so intense you’d better look for shade.
That’s roughly how the Rainbow Chart works — only instead of a beach, we have the market.
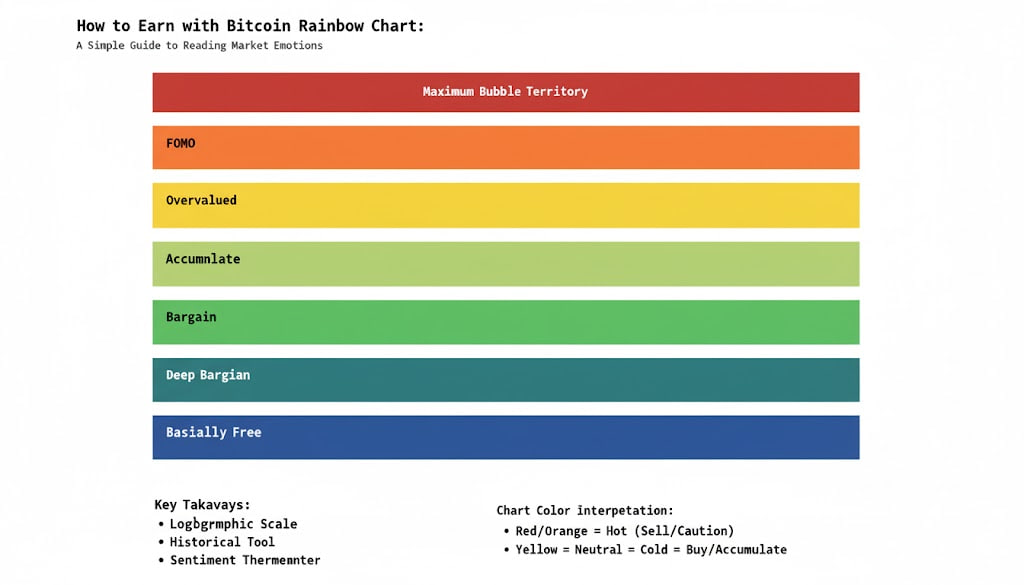
Source: gemini.google.com
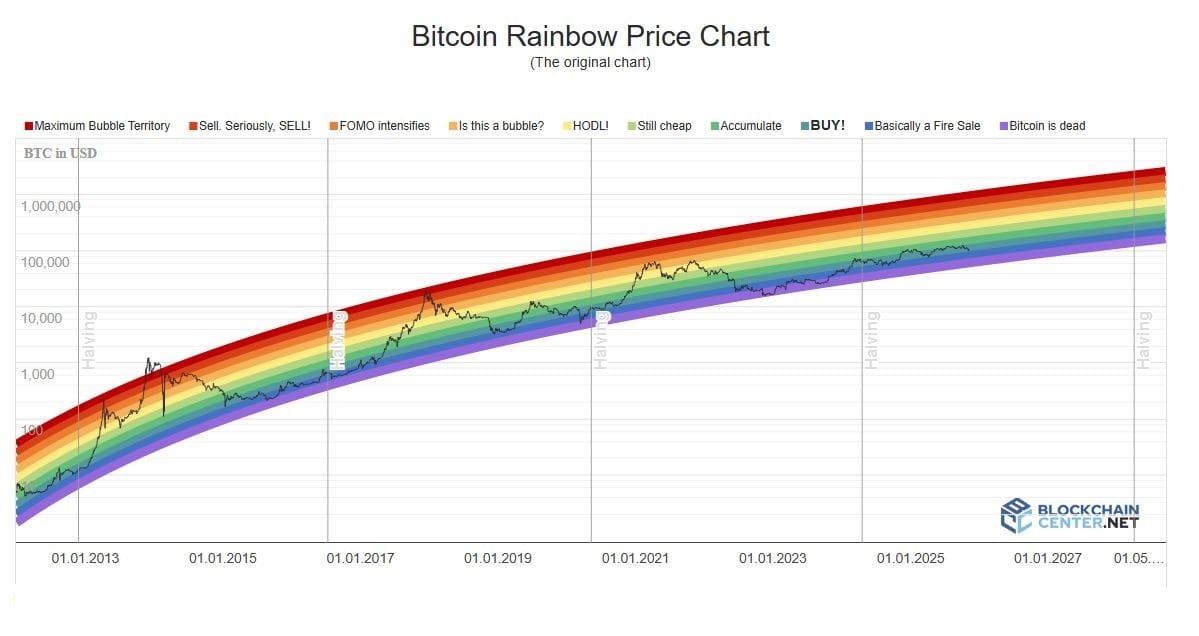
Blue bands on the chart reflect “cold” market conditions — pessimism, fear, despair. Red bands represent “overheating,” when the crowd has lost its mind and is ready to buy “with everything they have.”
The rainbow itself is a logarithmic model (if we drop the scientific wording — just a smart way to smooth the price over many years) that shows where we are in the emotional cycle and how the crowd may behave next.
You can view it for free on Blockchaincenter:
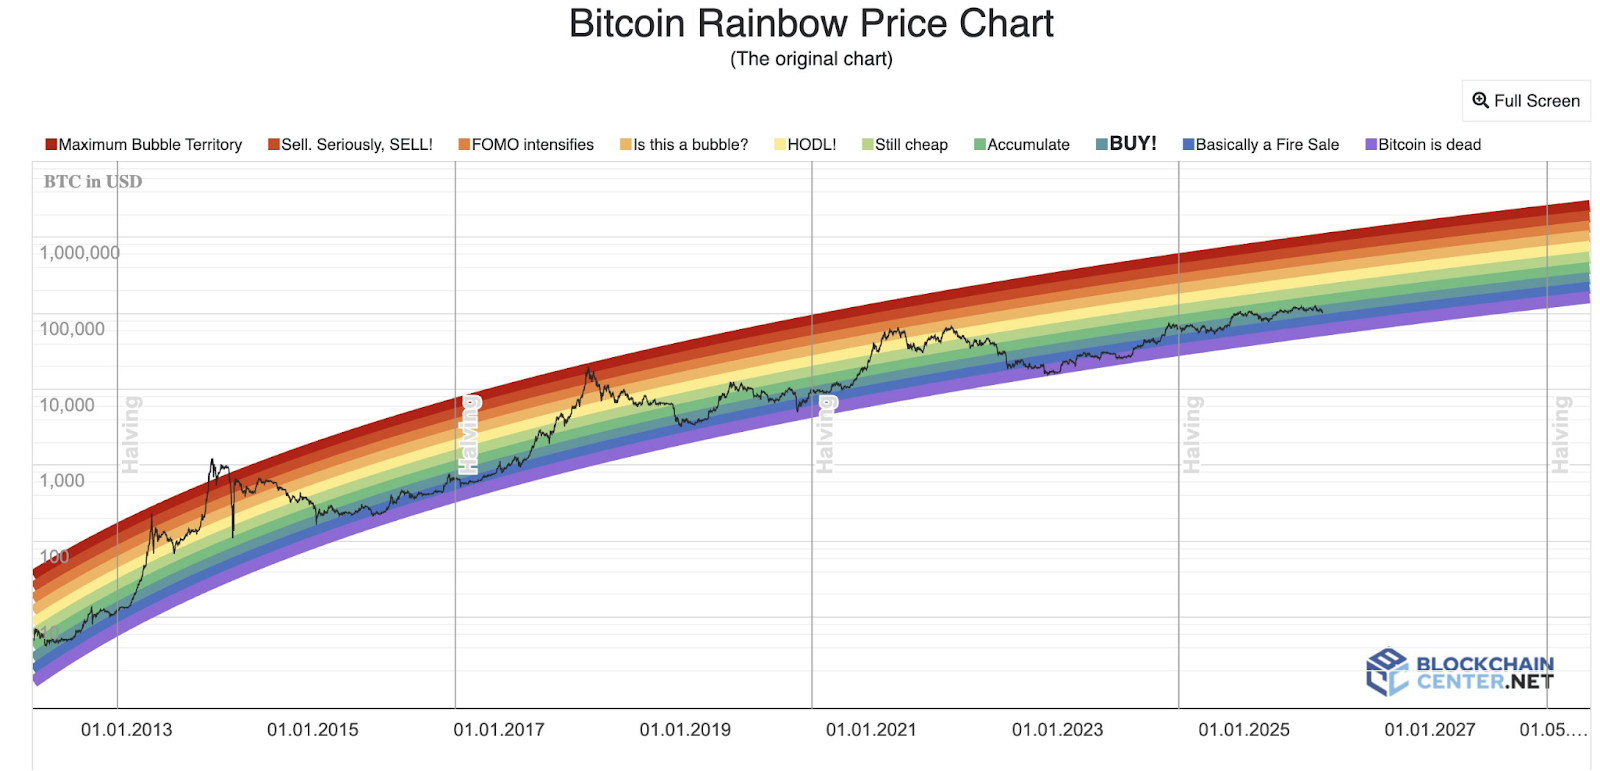
Source: blockchaincenter.net
Why this is especially important in 2025–2026
Over the past two years, the crypto market has stopped being a “toy for geeks.” With the arrival of Bitcoin ETFs from BlackRock, Fidelity, and other giants, the flow of institutional money exceeded $100B (BlackRock, Fidelity ETF reports, 2025).
Analysts note a significant increase in the share of institutional capital in BTC spot trading — estimates show it could account for a large portion of the market. For example, Chainalysis reports a rise in large transfers (over $1M) from institutional players.
It’s like if small local vegetable markets suddenly started receiving bulk buyers — supermarkets and restaurant chains. Prices and dynamics will never be the same. But — attention — the psychology of retail players hasn’t changed: the crowd still comes late, buys “at the top,” and sells “in depression.”
Which means the Rainbow Chart remains useful — as an emotions compass that helps you think ahead rather than trade impulsively.
A simple everyday analogy
Imagine a small neighborhood apple market.
● In winter, apples are expensive, not very tasty, but demand is high — people miss vitamins. ● In summer, apples are cheap, flavorful, sellers give free samples — take as much as you want.
It’s the same in crypto: the crowd pays the most during the “winter” of market overheating and turns away in the “summer” of low-priced opportunities.
The Bitcoin Rainbow Chart is like a seasonal fruit calendar — only for Bitcoin. It doesn’t say: “Buy on January 7th exactly,” but it suggests: “This is the sweet-price season” or “Careful, you’re overpaying now.”
The main beginner’s mistake — and why they lose money
Beginners in crypto behave like tourists in a new city:
● They see a crowd → they go there too ● They hear noise → they buy ● They see a queue → they are sure “you must grab it while you can”
As a result, most people enter in the red zone when the market is already overheated, and then sell in panic — in the blue zone when prices are low.
Analytics by CoinGlass highlights that unprepared traders often lose a significant share of potential profit due to emotional trading and poor timing.
The Rainbow Chart isn’t magic; it simply helps you realize: “Right now you’re entering where there’s already a long line” or “It’s discount season — buy calmly while it’s quiet.”
Why the “rainbow” doesn’t tell you the exact future price
Many people think: “Oh, it’s a rainbow — so I can predict the price!” No. It’s not a crystal ball.
The Rainbow Chart is more like a weather season calendar: it shows seasons but doesn’t guarantee that July 14th will be +27°C with sun at 12:40.
It won’t answer: “Should I buy at $63 200 or $64 900?” It answers where we are moving in the emotional cycle.
And that is enough to avoid being the last buyer and the first panic seller.
We’ve covered what the Bitcoin Rainbow Chart is and why it works. Now — the juicy part: how people actually make money with it, without stress, formulas, or trading 24/7.
How to use the Rainbow Chart to make money: no math, just logic
Imagine the Rainbow Chart as a navigator like Google Maps, but for cryptocurrency. It doesn’t lead you through specific streets — it shows the overall congestion of the road:
● Green road — no traffic, you can go faster ● Yellow — denser ● Red — jammed, be cautious
The Rainbow Chart does the same — but with Bitcoin’s price and crowd behavior.
Below are three simple strategies suitable for everyday people — not “traders with three monitors”.
Strategy #1: “Smart Seasonal DCA”
(for those who don’t have time to track the market)
You’ve likely heard of DCA — buying a fixed amount regularly, for example every week. The Rainbow Chart offers an upgraded version — buy more in the cold, less in the heat. Imagine:
You decide to invest $200/month into Bitcoin. But if we’re currently in the “blue zone” — why not buy $400, since it’s a “winter sale”?
It’s like buying winter boots in August on discount, instead of paying triple in January. How it looks in practice:
🧊 Blue zone — “Pure Discounts” → double the monthly amount 🍃 Green — “Good Value” → increase by +50% 🌤 Yellow — “Fair Price” → regular purchase ☀️ Orange — “Expensive” → reduce by 50% 🔥 Red — “Crowd Frenzy” → you may pause buying
This approach isn’t trading — it’s smart habit-based buying. According to CoinGlass backtests, this model outperformed regular DCA by 22–35% across previous cycles.
Life analogy: — when items are on sale — you stock up; — when everything is overpriced — you buy only essentials.
Strategy #2: “Calm Profit Taking”
(for those who want to profit without trying to “catch the top”)
One of the most painful beginner mistakes is greed. They wait for “just a bit more” — and then the profit disappears.
The Rainbow Chart suggests a gentle, psychologically comfortable method: instead of “sell everything”, sell in parts — as the market heats up.
A real-life comparison:
You’re at a fair. You bought rare sweets. The price goes up every hour. You won’t hold them until the very last piece hoping to sell at the absolute peak — you’ll sell some as demand increases.
In crypto, it looks like this:
● In the orange zone — take some profits● In the red zone — take more● Leave the rest as “dessert” — in case the market surprises
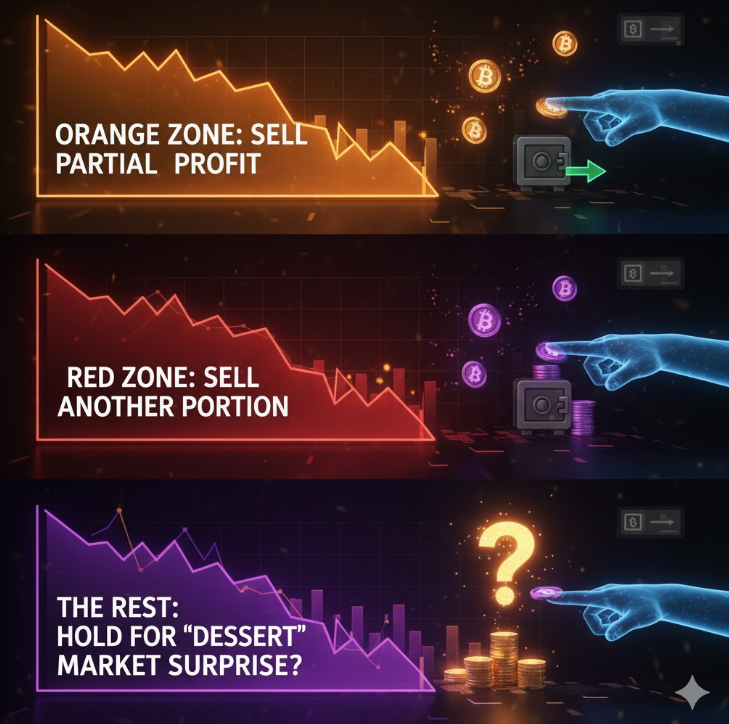
Source: gemini.google.com
You are “skimming the cream” without fully exiting the market.
And the best part? You stop obsessing over “but what if it pumps more?” — because you’re already securing gains along the way.
Strategy #3: “Rotation into Altcoins During the Heat Season”
(for those who want higher returns, but without full casino vibes)
Here it’s important to understand crowd psychology:
When Bitcoin enters the “hot zones” (orange-red), the crowd begins hunting for “new X’s” — and flows into altcoins. Altcoins usually “overheat” later, but stronger.
It’s like a festival: first, a huge line forms at the most famous food truck (Bitcoin). When the queue becomes an hour long — people spread out to other stalls (altcoins), and that’s where the boom starts.
Example from the crypto world (2021):
When BTC was in the red zone:
● Ethereum delivered another +240%● Solana — about +900%● AVAX — +1100%
But! This strategy is for people with some experience. It’s tasty like spicy food — but not for everyone. If you’re a beginner, master the first two strategies, and leave this one “for later”.
Where is the profit here? Explaining in money language
The Rainbow Chart helps you buy cheaper and sell higher — without guessing the exact day.
If a person in each cycle simply: bought in “blue-green” zones, and sold partially in “orange-red” zones, their results would look roughly like this:
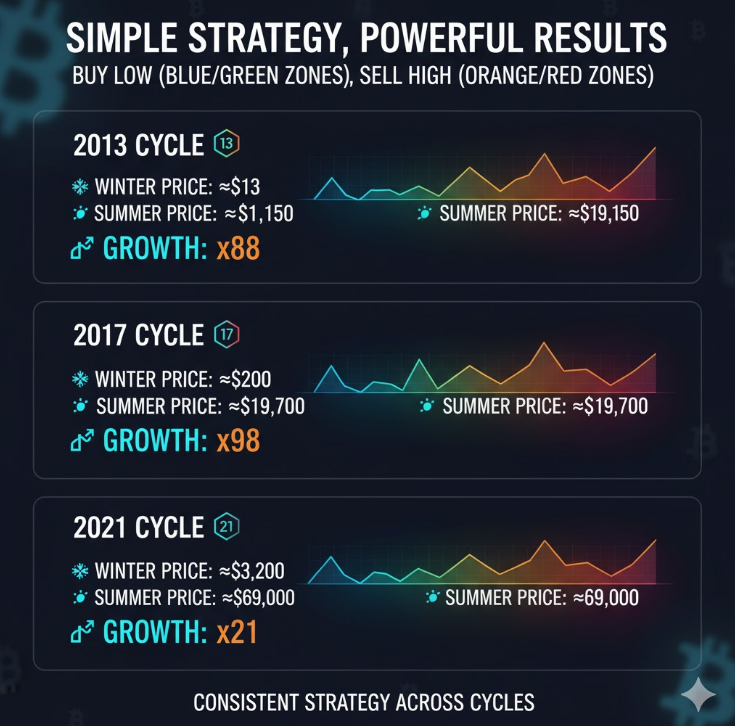
Source: gemini.google.com
This is not an ad, not a promise, and not magic — it’s a long-term pattern of crowd psychology.
Real Story — “The Mom Investor”
One reader — let’s call her Tatiana, 42, accountant. She is not a trader; she doesn’t have time to watch charts. In 2019, her son told her: — “Mom, buy a little every month.”
She started buying $50–$100 monthly. When in 2020 the Rainbow Chart entered the blue zone — her son convinced her to double purchases. When in 2021 the chart hit the orange zone — she sold only a part, not everything.
Result: instead of “holding until the crash and crying”, like many of her colleagues, she took some profit to renovate her kitchen and left the rest invested.
Not because she “predicted the market”. But because she saw the colors and understood the crowd’s mood.
Mistakes almost everyone makes — and how to stop repeating them
If we highlight the three main traps beginners fall into, here they are:
❌ 1. Buying in the red zone — because “everyone’s saying so”
Classic. When the market peaks, bloggers, friends, media — everyone screams: “Buy, you’ll regret missing this!” The fear of “missing out” is one of the most expensive emotions in life.
How to avoid: When there’s noise around — it’s not a signal to buy, but a sign to breathe and check the rainbow colors.
❌ 2. Selling everything too early — out of fear of losing profits
Someone buys, Bitcoin grows — and the fear kicks in: “I must fix profits now! What if it drops tomorrow?!”
As a result — they take small profit in the yellow zone, and the market later goes much higher. How to avoid: Don’t jump off the boat completely — skim the cream step by step.
❌ 3. Waiting for the perfect point
The “ideal entry/exit point” is like winning the lottery. Possible, but not a plan. The Rainbow Chart teaches: we take the season, not the day.
Expert forecast: will the Rainbow Chart work going forward?
Short answer: yes, but with adjustments.
“The Rainbow Chart is not a prediction tool. It is a self-discipline tool. It will work as long as people remain human.” — Analyst at Kaiko
“In 2026–2027, cycles will become smoother due to institutional capital, but retail psychology isn’t going anywhere.” — CTO of crypto fund FalconX
How the Rainbow Chart connects to other crypto trends
● DeFi: in “blue-green” zones it’s profitable to accumulate assets and enter staking and liquidity while APR is high and entry prices are low.
● ETFs: funds lock in profits in stages — this reinforces the logic of “laddered profit-taking.”
● Mining: after the 2024 halving, mining costs increased, but market psychology remains cyclical.
● On-chain analytics: the Rainbow Chart pairs well with MVRV, Netflows and funding metrics (see Glassnode, CoinGlass).
The Rainbow Chart is not “just another indicator” — it’s a language that explains the market in human terms.
FAQ
What is “how to earn off bitcoin rainbow chart”? A crypto earning approach based on understanding emotional “market seasons” rather than guessing exact prices.
Is it really possible to make money using the Rainbow Chart? Yes — if you use it as a compass for buy/sell decisions: buy in the “cold” and take profit in parts during the “heat.”
Is this suitable for beginners? Yes. Even better than most strategies — no daily trading required.
Should I sell everything at the peak? No. Better to sell partially, in steps. The Rainbow isn’t about gambling — it’s about calm.
Does it work with DCA? Perfectly. It’s “DCA+, the upgraded version.”
Can this be used for Ethereum and altcoins? Yes, as a reference: when BTC is in the heat zone, altcoins often accelerate.
Does the Rainbow Chart influence the crypto market? It doesn’t control the market, but many individuals and funds use it as a sentiment barometer.
What to do in 2025? Use the Rainbow as guidance and verify decisions with CoinGlass, Nansen, and DeFiLlama data.
Most common mistakes? Buying in the red zone, selling everything too early, and waiting for the perfect moment.
Where to follow updates? Chart here: https://www.blockchaincenter.net/en/bitcoin-rainbow-chart/
Small checklist for readers (CTA)
Want to start applying the Rainbow without stress? Complete this mini-checklist:
● Open the Rainbow Chart● Check which “season” we’re currently in● Decide your monthly budget● Write in advance what you will do in blue/green/red zones● Keep an “investor emotions diary” — one sentence per week
Source: blockchaincenter.net
Final Thoughts
The Bitcoin Rainbow Chart is not a magic formula and not a tool to “guess the price,” but a simple and visual way to understand overall market sentiment. It helps you see when the market is overheated and emotions are extreme — and when it’s undervalued and everyone is turning away.
Its main value is that it reduces emotional decision-making: it reminds you not to buy during hype and not to sell in panic. But it should be used along with other factors — news background, on-chain metrics, and your own strategy.
In short: the Rainbow is a guide, not a get-rich recipe. Treat it as a compass that helps you slow down or move more confidently — and it will become a valuable part of your crypto mindset.
To strengthen your foundation, start with the basics: subscribe to GoMining Academy and get access to the free course → https://academy.gomining.com/courses/bitcoin-and-mining
Telegram | Discord | Twitter (X) | Medium | Instagram