

Key Takeaways
- Crypto markets are moving lower alongside a broader shift toward risk-off positioning across global assets.
- The decline is broad, with Bitcoin, Ethereum, and major altcoins falling at the same time rather than rotating between sectors.
- Market data points to tightening liquidity and leverage unwinds as the primary sources of pressure, not crypto-specific failures.
- Sentiment indicators reflect elevated stress and caution, without clear signs of a structural breakdown.
- Whether this move remains a correction or develops into a deeper sell-off will depend on liquidity conditions and positioning, not short-term headlines.
What’s happening in the crypto market today
As of February 4, 2026, the crypto market is moving lower across the board. Total market capitalization has slipped to roughly $2.5 trillion, extending a multi-day pullback rather than responding to a single headline or event. Trading volume has risen during the decline, a pattern that often appears when selling pressure spreads broadly across the market.
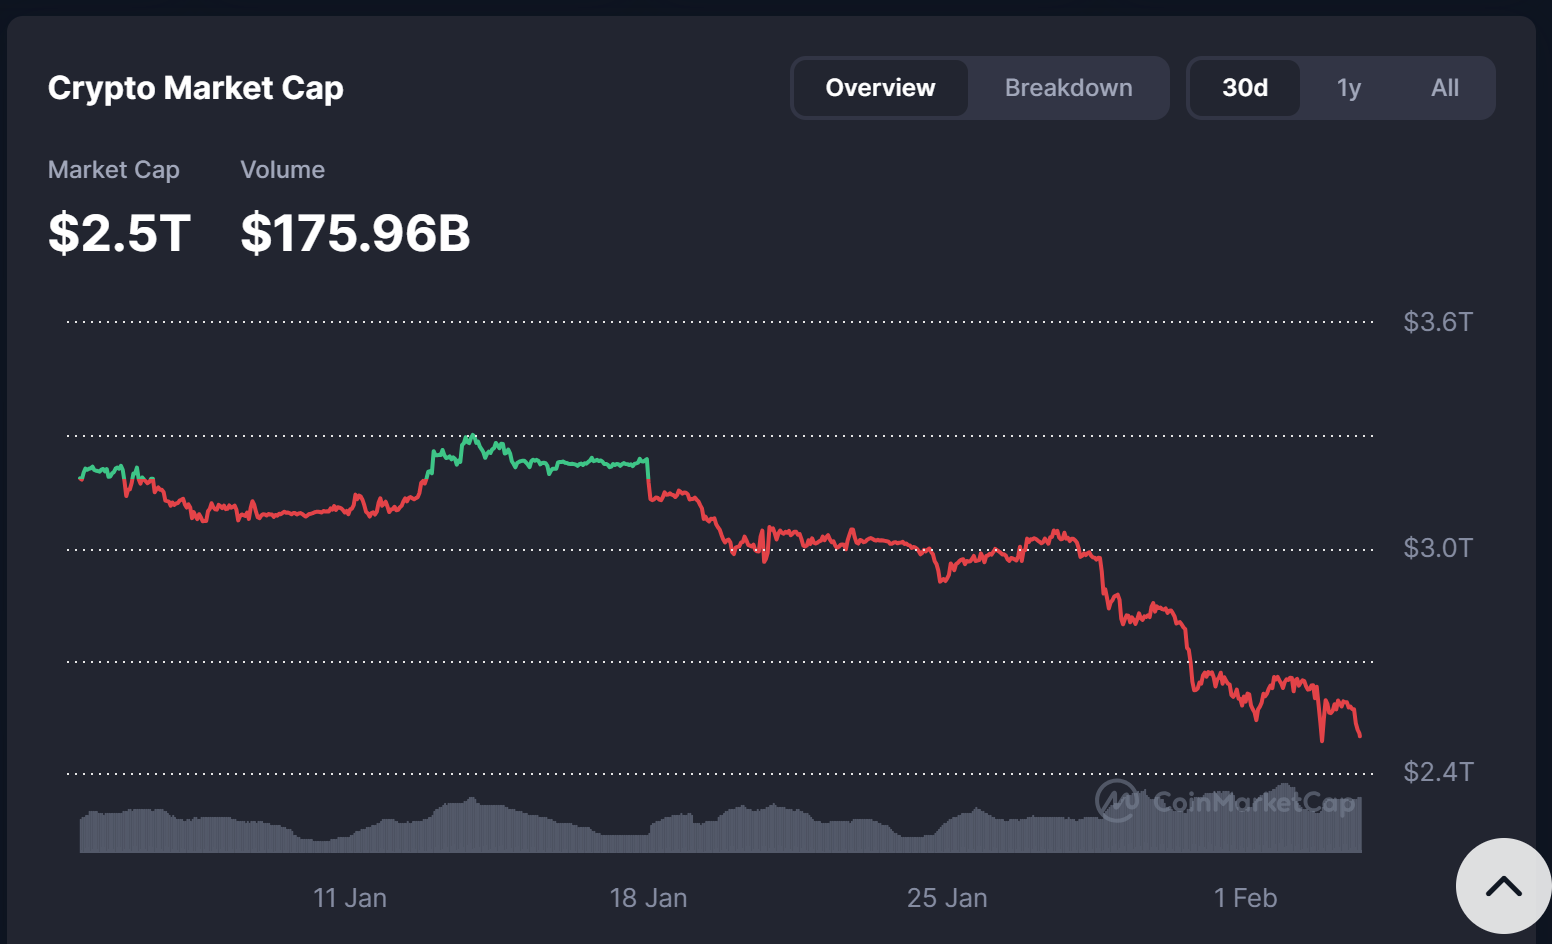
Total Crypto Market Cap. Source: coinmarketcap.com
This weakness is not isolated to one segment. Bitcoin, Ethereum, and most large-cap altcoins are down over the past week, pointing to a market-wide contraction instead of capital rotating between sectors. At the same time, sentiment indicators have deteriorated sharply, reflecting growing caution among participants as prices move lower.
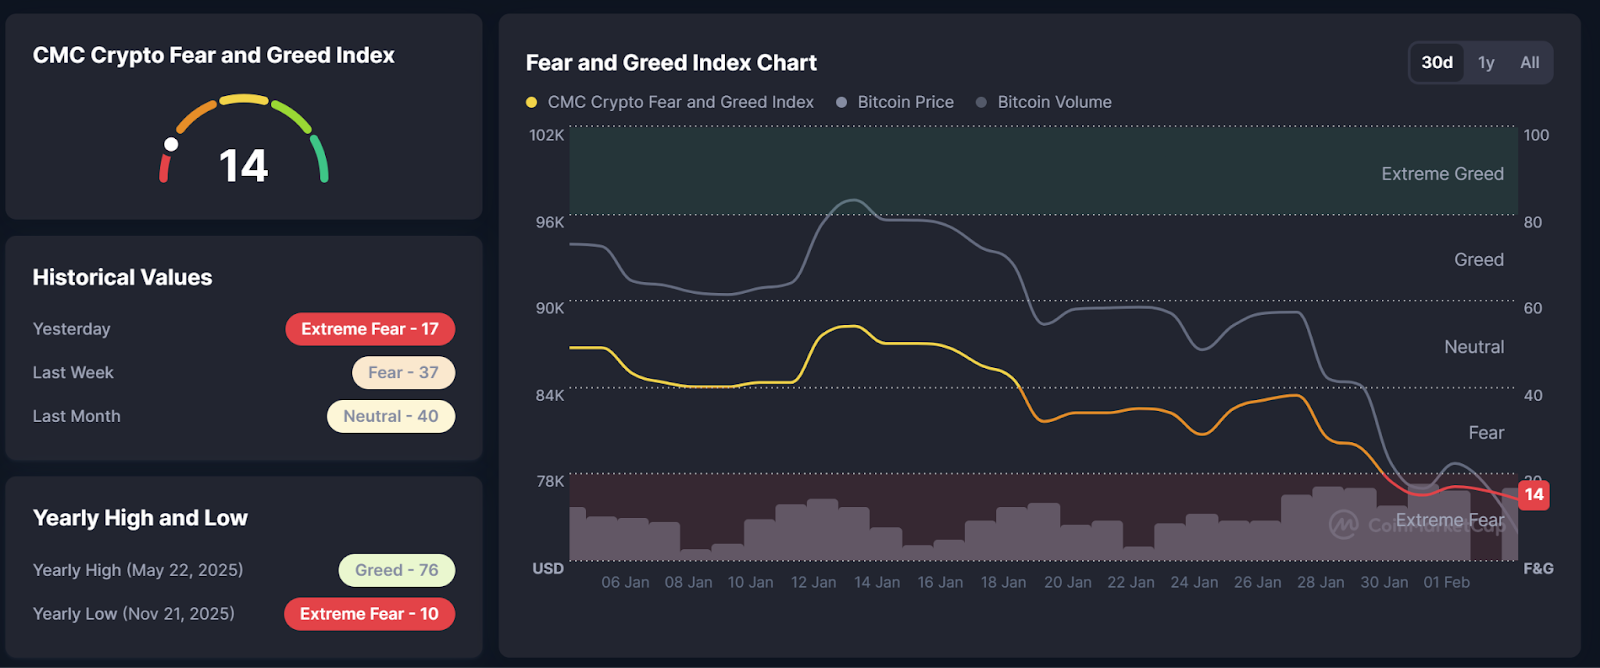
Crypto Fear and Greed Index. Source: coinmarketcap.com
Today’s top losers across major crypto markets
On days like this, the largest percentage declines often show up in small, thinly traded tokens. Those moves can look dramatic, but they rarely explain what is happening across the broader market.
This section focuses instead on high-liquidity, widely held assets such as Bitcoin, Ethereum, and major altcoins. These are the assets most traders, funds, and institutions are exposed to. When they decline together, it usually reflects broad de-risking rather than isolated project-specific problems.
Recent price action shows that large, liquid assets with higher volatility are absorbing the bulk of the selling. This pattern commonly appears during risk-off phases, when market participants reduce exposure across the board instead of rotating between sectors.
The assets below are selected from the top tier of the crypto market by liquidity and market participation, not by absolute percentage decline.
While each asset has its own market dynamics, the shared signal matters more than the individual moves. These declines are occurring simultaneously, with elevated volume, across assets that normally anchor market liquidity. That points to systemic pressure rather than isolated weakness.
Why crypto is down today
Today’s decline is not being driven by a single trigger. Instead, several overlapping forces are applying pressure at the same time, shaping how prices, liquidity, and sentiment are interacting across the market.
Risk-off sentiment is dominating price action
Across global markets, investors are showing less appetite for volatile assets. In these environments, capital usually reduces exposure to higher-risk positions first. Crypto, despite its distinct fundamentals, tends to follow this pattern when uncertainty rises.
This shift is visible in market positioning. Bitcoin dominance has moved higher, suggesting capital is concentrating in perceived safer assets within the crypto market rather than rotating into smaller or more speculative tokens.
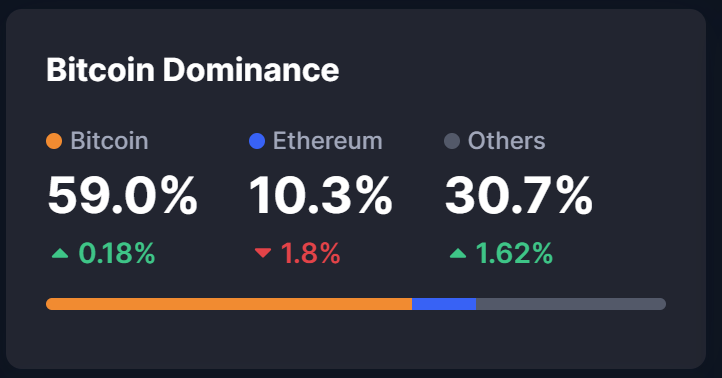
Bitcoin Dominance. Source: coinmarketcap.com
Sentiment data reinforces this picture. The Crypto Fear and Greed Index has dropped to 14, a level classified as extreme fear. Historically, readings in this range reflect elevated stress and uncertainty, not confident reallocation or selective buying.
Liquidity is tightening, and leverage is unwinding
Liquidity conditions play a central role in price stability. When liquidity tightens, fewer buyers step in during declines, allowing prices to move lower with less resistance.
At the same time, leveraged positions can amplify downside moves. As prices fall, margin requirements increase and forced liquidations add mechanical selling pressure. This process often accelerates declines once key price levels are breached, even in the absence of new negative news.
ETF flows are adding mechanical pressure
Recent spot Bitcoin ETF data shows net outflows of approximately $272 million on February 2, while Ethereum ETFs recorded modest inflows of around $14 million. This pattern points to selective exposure reduction rather than a broad exit from digital assets.
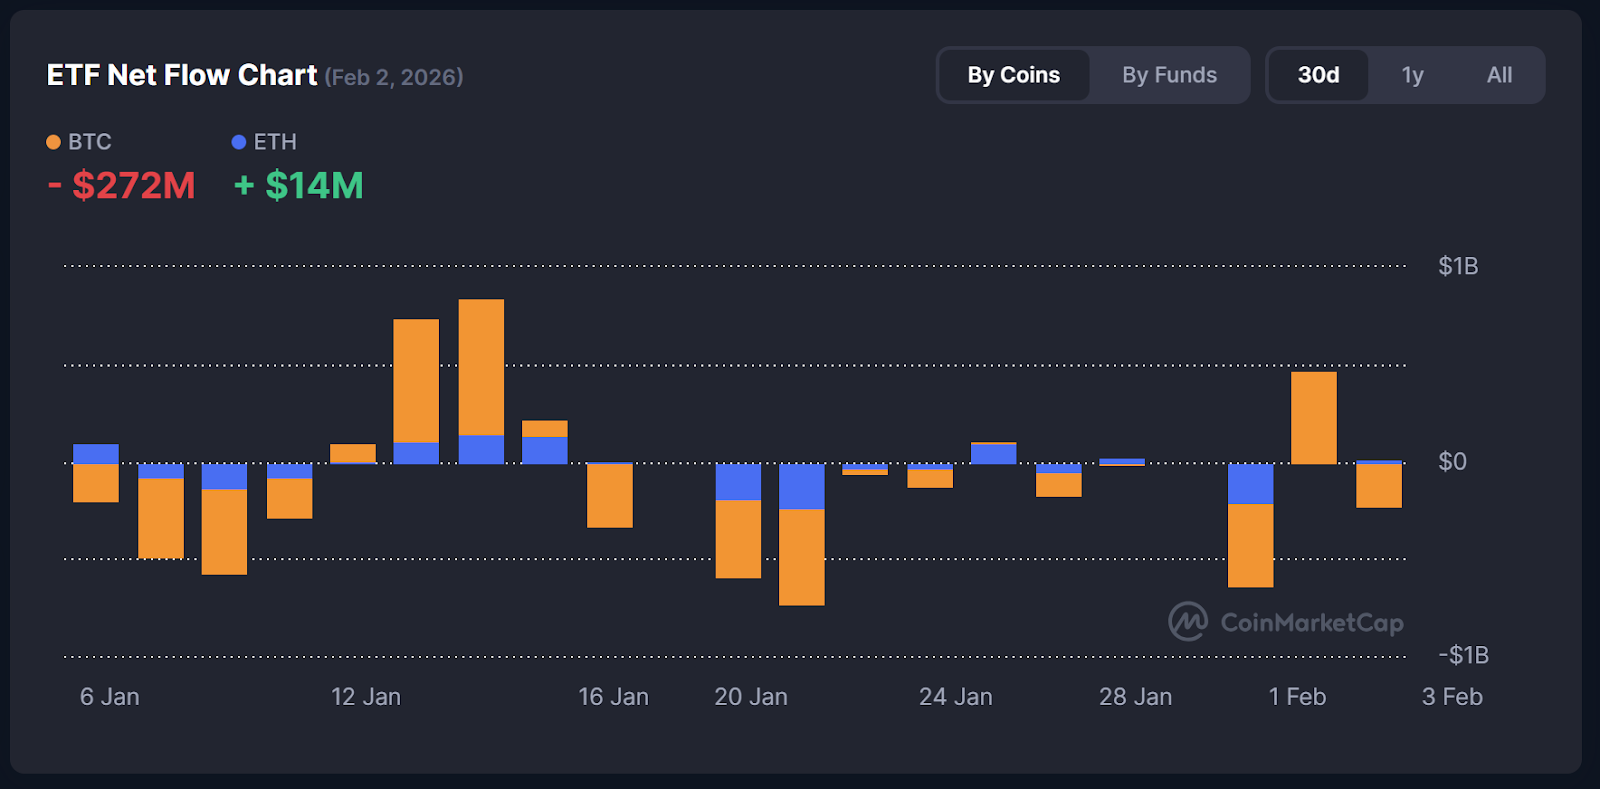
ETF Net Flow Chart. Source: coinmarketcap.com
ETF flows matter because they represent one of the most transparent channels of institutional positioning. Sustained outflows can contribute to ongoing selling pressure, while stabilization in flows often coincides with price consolidation.
Sentiment and price are reinforcing each other
During periods of stress, price, volume, and sentiment tend to move together. Falling prices increase fear, fear encourages further selling, and that selling pushes prices lower. This feedback loop can persist even without fresh catalysts.
It is important to note that sentiment indicators describe current conditions, not future outcomes. Extreme fear does not confirm further declines, but it does signal that caution, rather than confidence, is shaping market behavior.
Quick guide — how to assess today’s crypto dip
When markets move lower, a few observable market behaviors help clarify whether pressure is easing or still building. These are descriptive markers of current conditions, not tools for prediction.
- Selling volume: Rising volume during declines often reflects active de-risking. When volume begins to fade, it can indicate that forced selling is slowing.
- Market breadth: If most assets are moving lower at the same time, stress remains broad rather than concentrated in specific sectors.
- Wallet and network activity: Sharp drops in on-chain activity may point to temporary disengagement, while steadier usage suggests participation remains intact despite price weakness.
- Liquidity conditions: Wider spreads and thinner order books tend to magnify moves. Improving liquidity usually reduces volatility, even if prices remain under pressure.
This framework helps explain how stress is moving through the market without relying on forecasts.
What to watch next
In the days ahead, a few developments will help frame whether the current pressure is stabilizing or still unfolding.
- Bitcoin and Ethereum ETF flows: Continued outflows would maintain mechanical selling pressure, while stabilization would reduce it.
- Total crypto market capitalization: Whether it finds a base or continues trending lower will shape short-term market structure.
- Sentiment readings: Movement away from extreme fear would suggest emotional pressure is easing, even if prices remain volatile.
- Leverage conditions: A slowdown in forced liquidations would indicate that excess leverage has largely cleared.
These factors describe how conditions are evolving, not where prices must go next.
FAQ
Is this a normal crypto correction?Crypto markets frequently experience sharp pullbacks. While current pressure is elevated, the move still fits within historical correction ranges.
How do wallet outflows affect prices?Large outflows can increase sell-side pressure, especially during periods of reduced liquidity.
Can the market stabilize quickly?Stabilization typically requires selling pressure to slow and liquidity conditions to improve, rather than sentiment alone.